How do I read the snowpack graph?
The snowpack graph shows how much snow a resort has had this season compared with previous years. It uses data from SNOTEL stations, which measure snow water equivalent: how much water you'd get if you melted the snow. Many stations have more than 30 years of history, so you're comparing this season against decades of past ones.
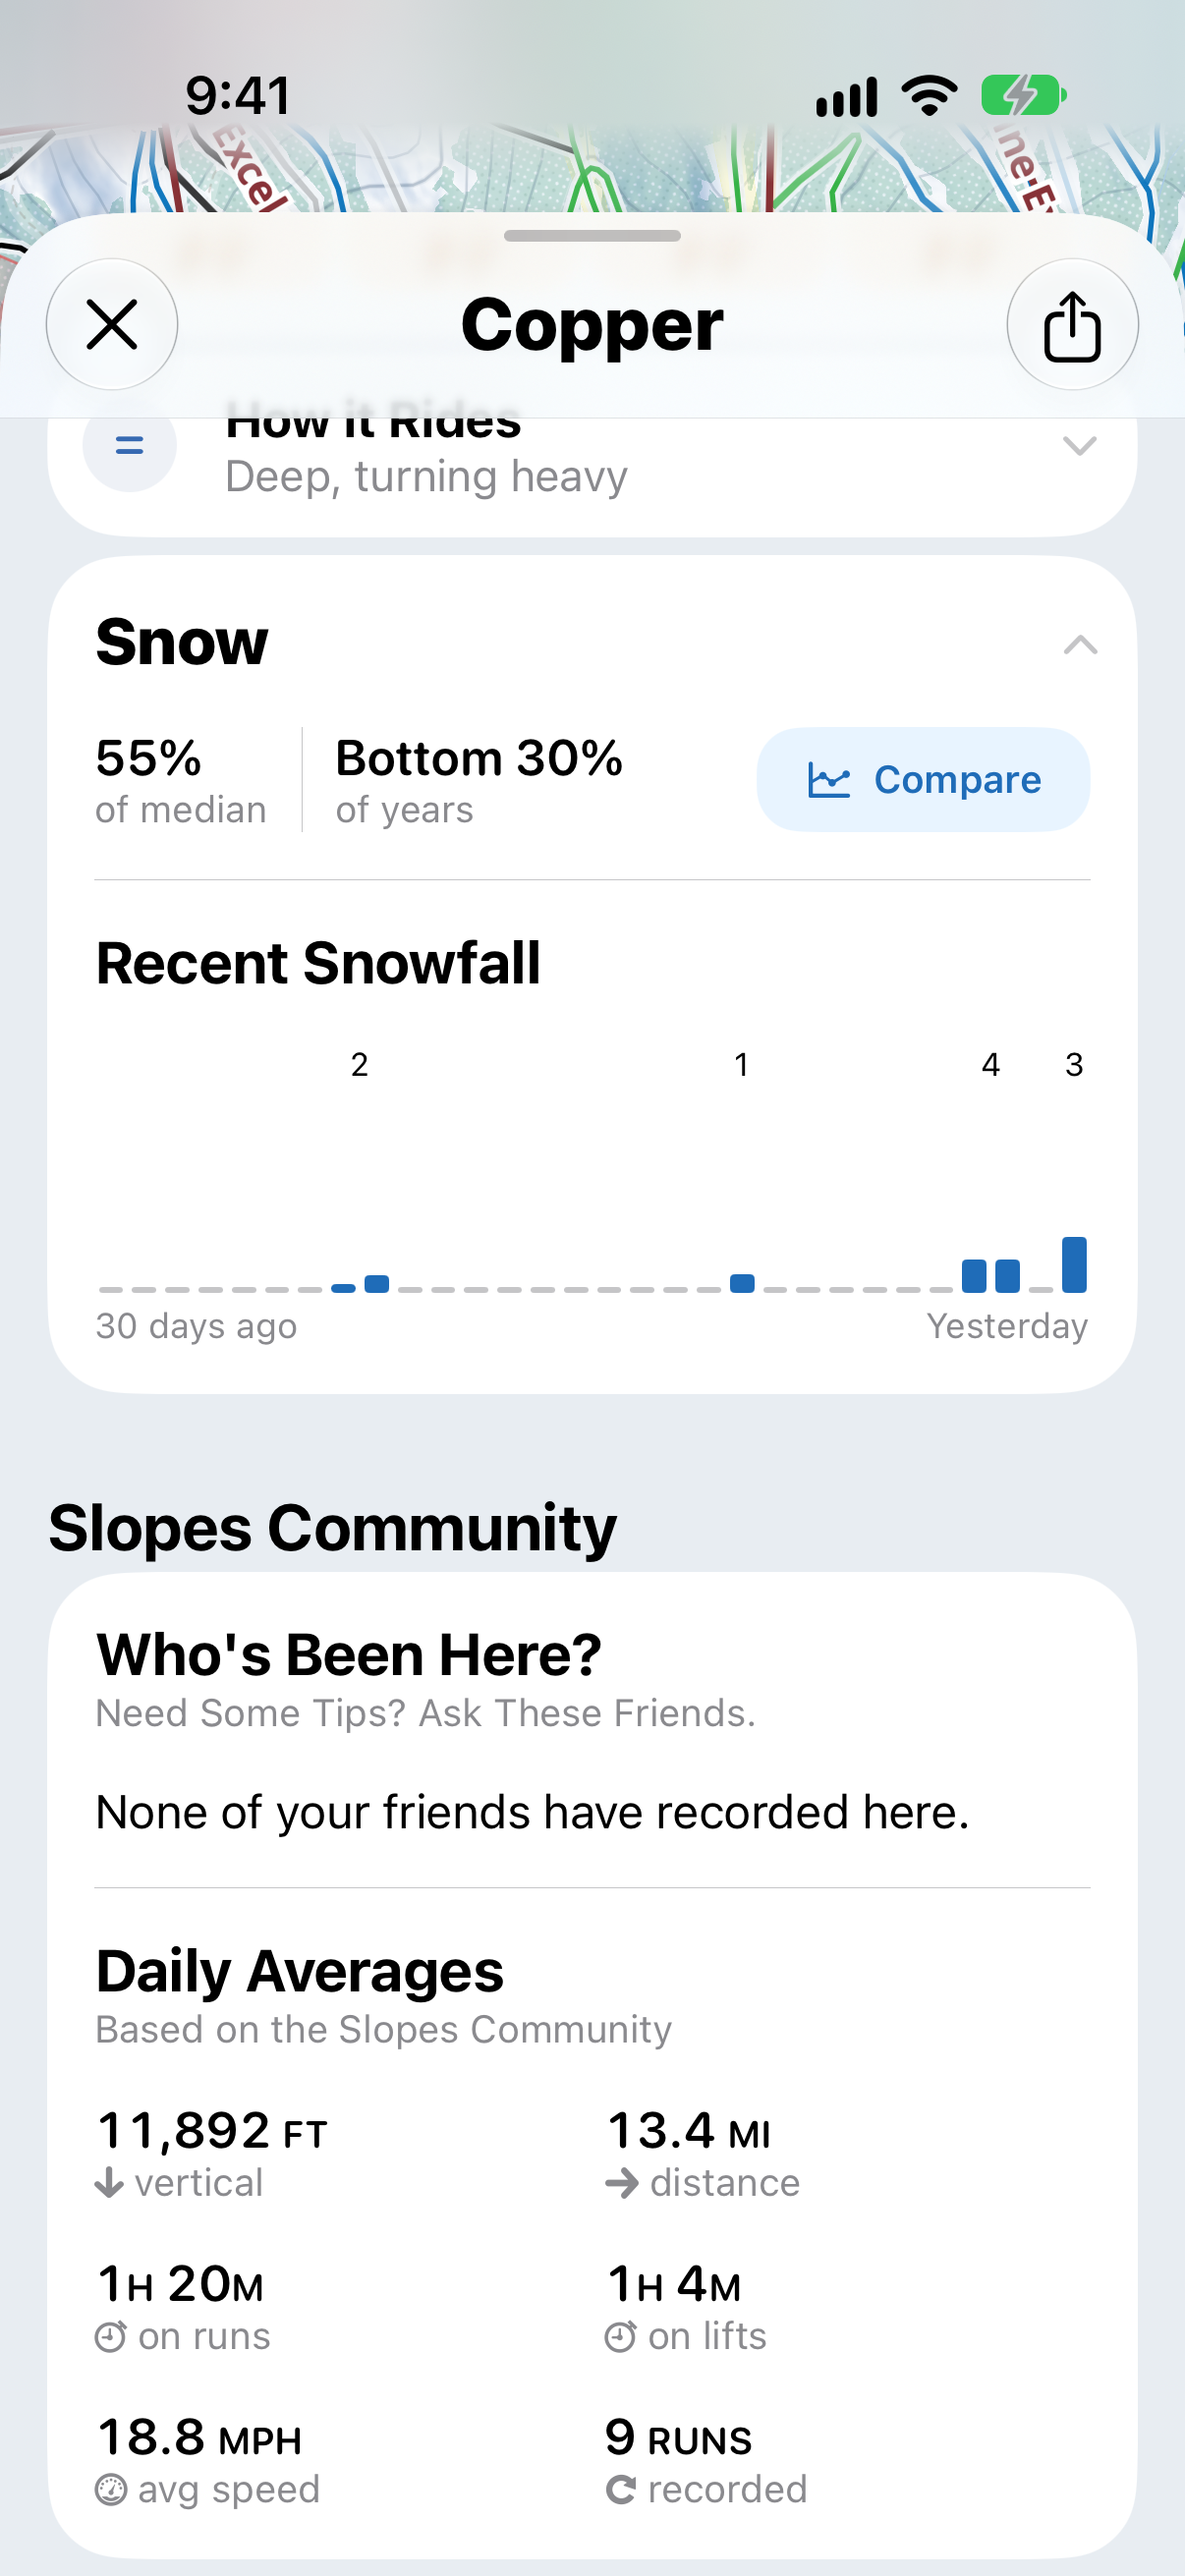
The graph is only available at resorts with a SNOTEL station nearby, which is most common in the western US. To open it, go to the resort's page and tap Compare on the Snow card.
What the colors mean
Most snow reports describe snowpack as a percentage of the median, like "110% of normal". That tells you there's more snow than usual, but not how unusual it is.
The graph shows how this season ranks against past seasons instead. The bands are marked at the 10th, 30th, 70th and 90th percentiles, and the card tells you where this season sits, for example Bottom 30% of years.
- Green: a typical season. About the middle 40% of past years.
- The bands either side: a lower or higher season than usual.
- The outer bands: unusually low or high. Only about 1 in 10 past seasons were this far out.
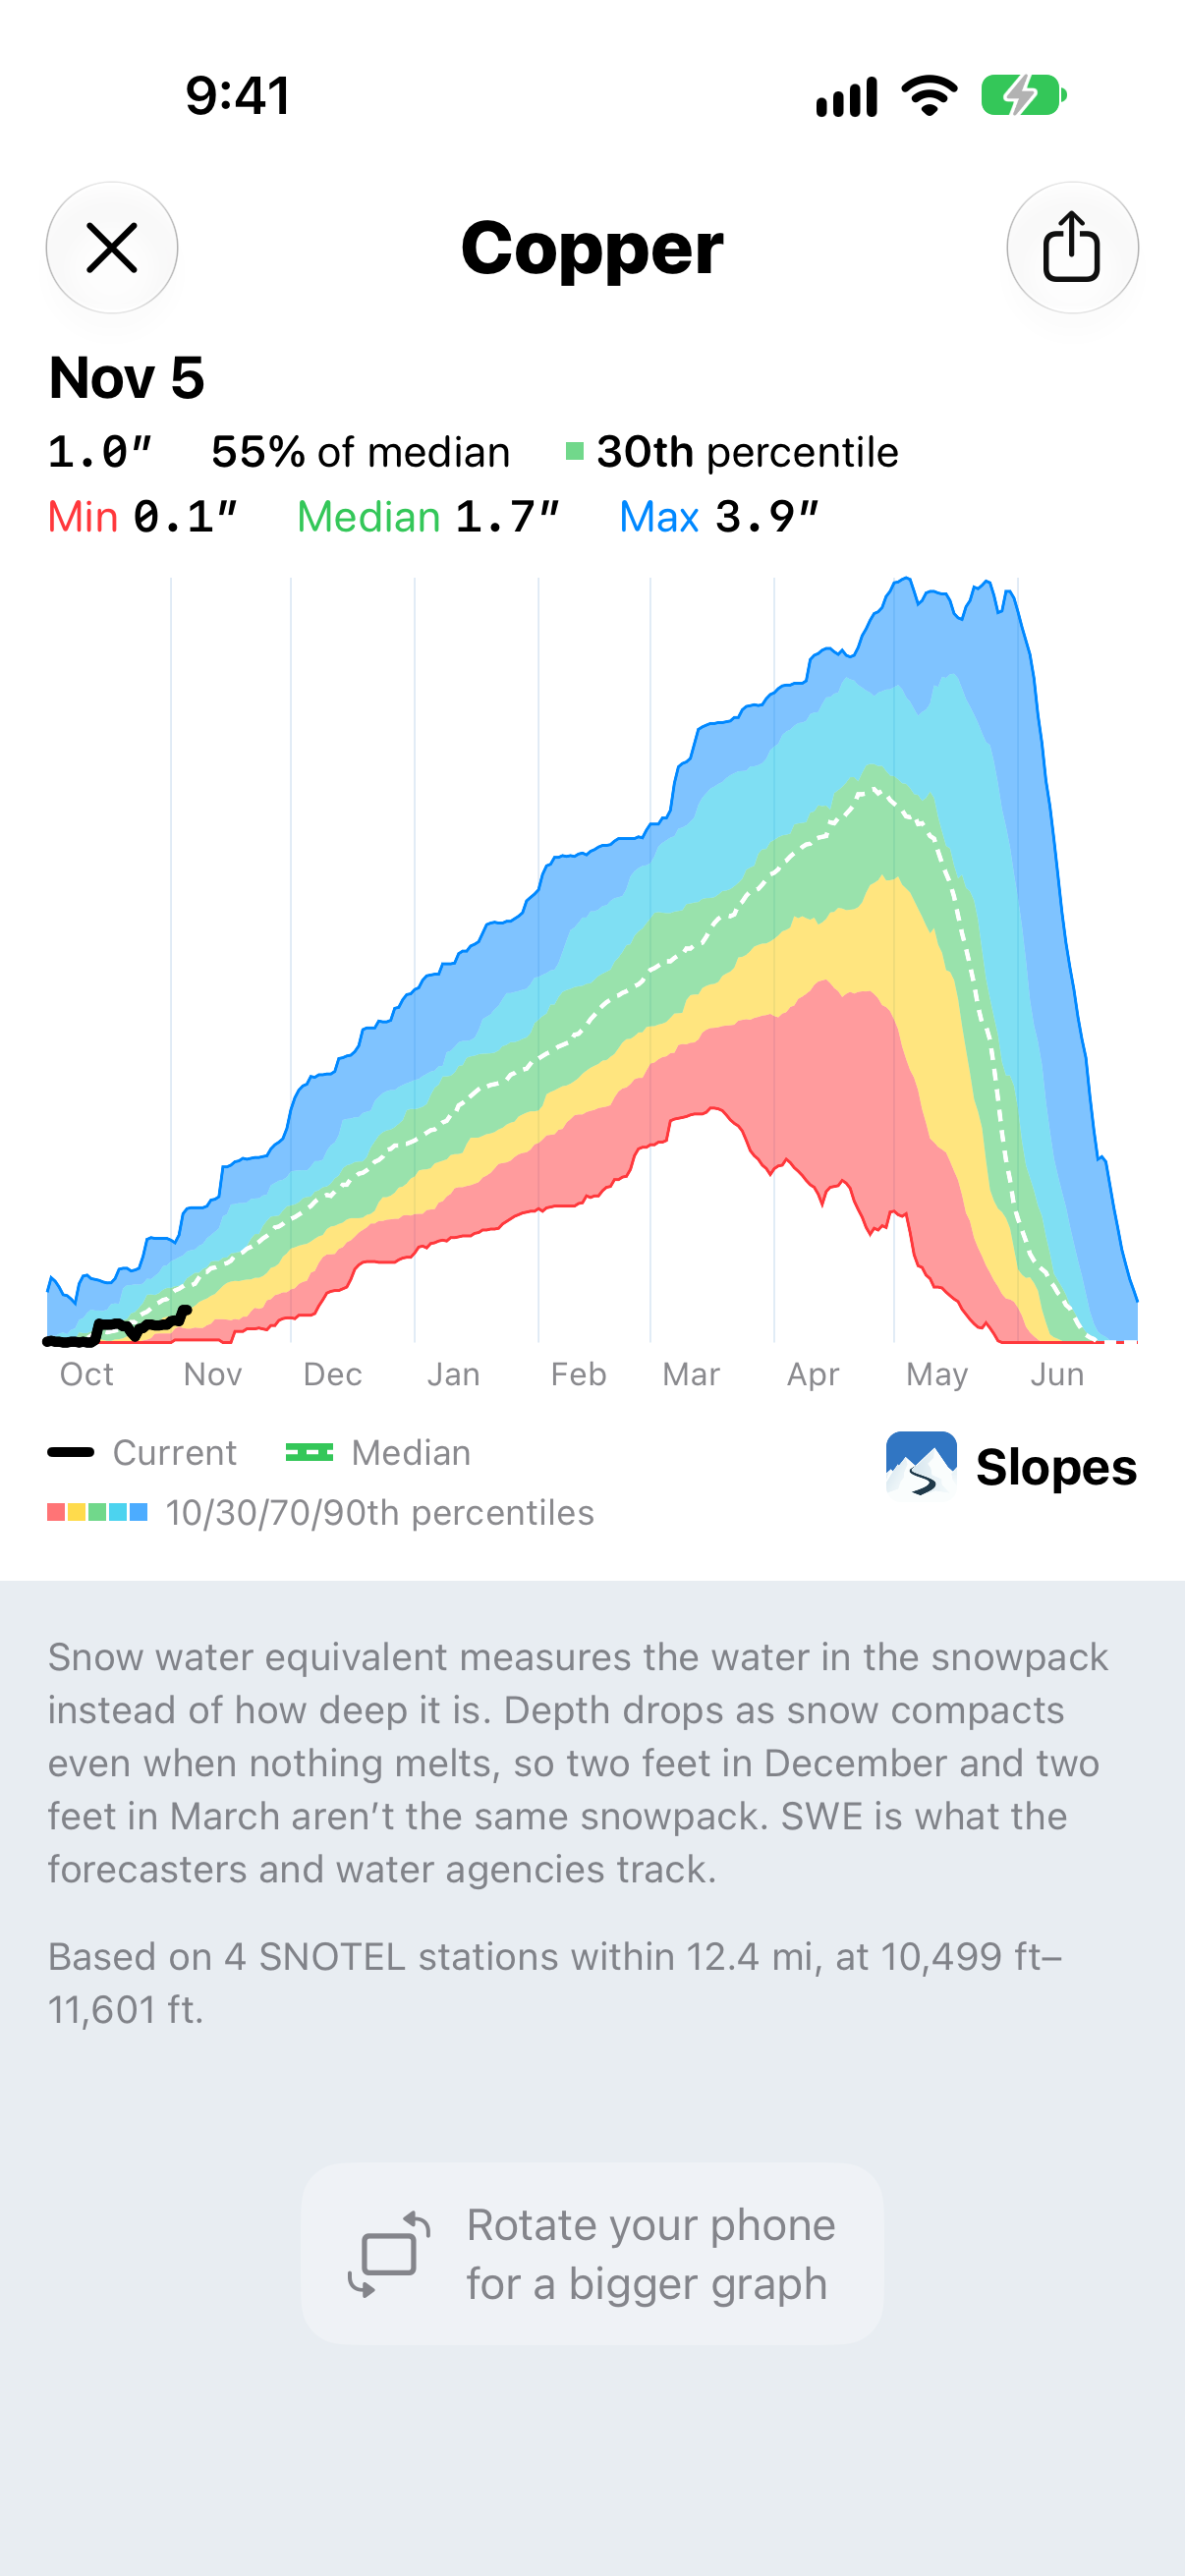
That's why a resort can be at 110% of median and still show as green. It's more snow than the median, but well within a normal year.
The snowfall bar on the Snow card uses the same colors, and still shows the percentage too.
Sharing the graph
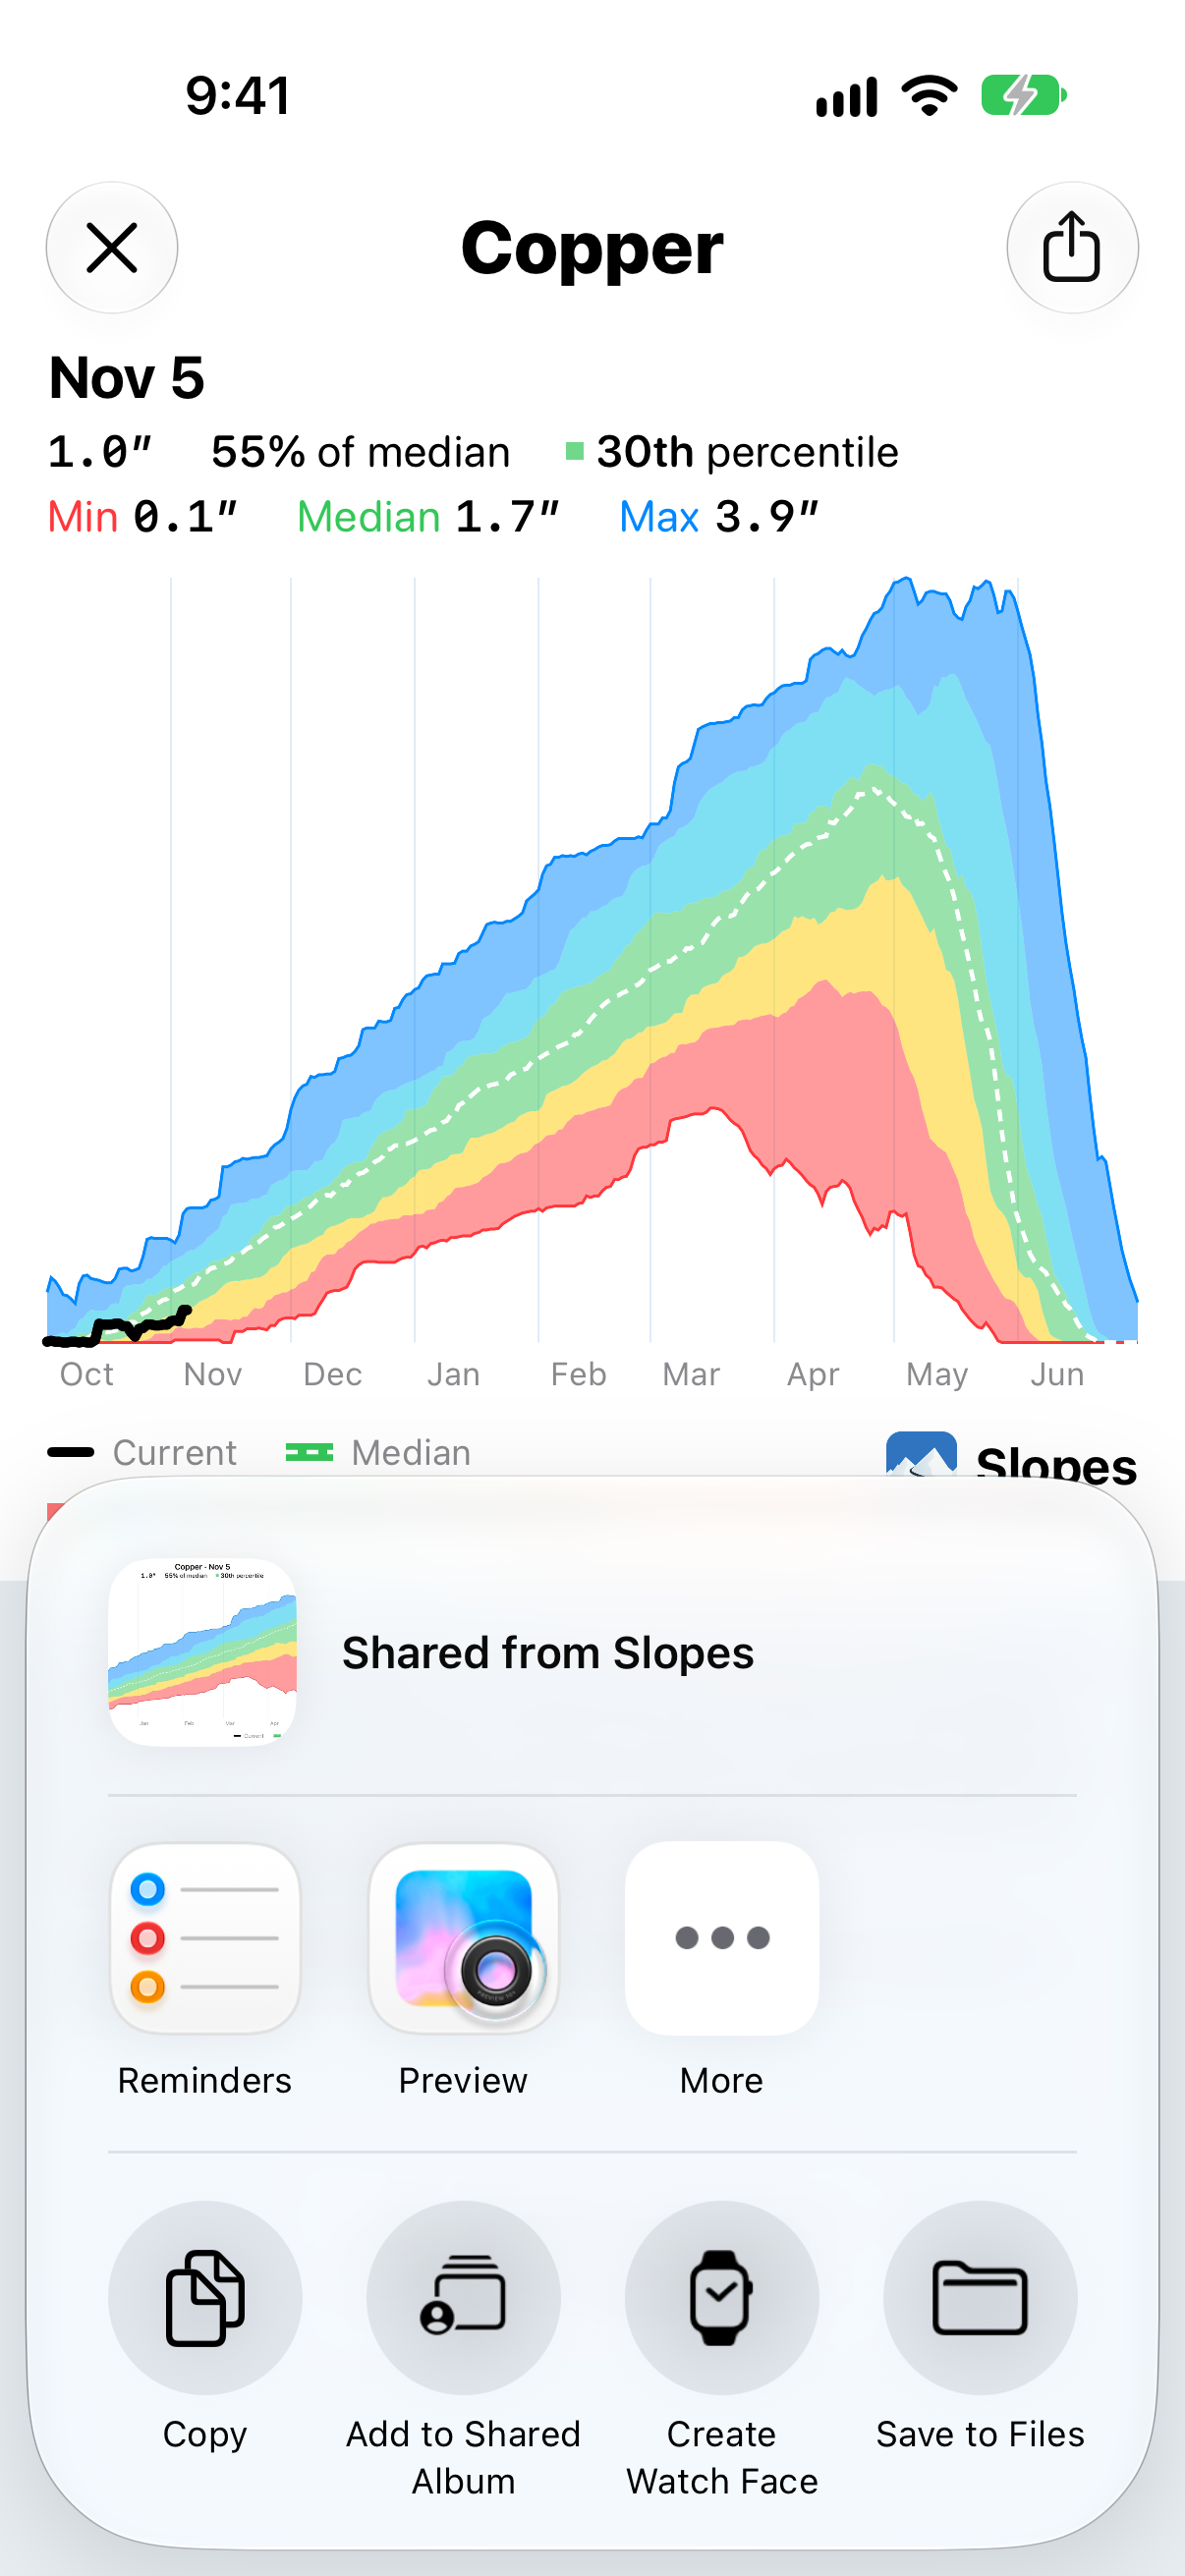
Tap the share button on the graph to save or send it as an image.
Add it to your home screen
There's a SNOTEL snowpack widget, so you can keep an eye on a resort's snowpack without opening Slopes. Touch and hold your home screen, tap Edit → Add Widget, then search for Slopes. To choose the resort, touch and hold the widget and tap Edit Widget.