What do the map overlays show?
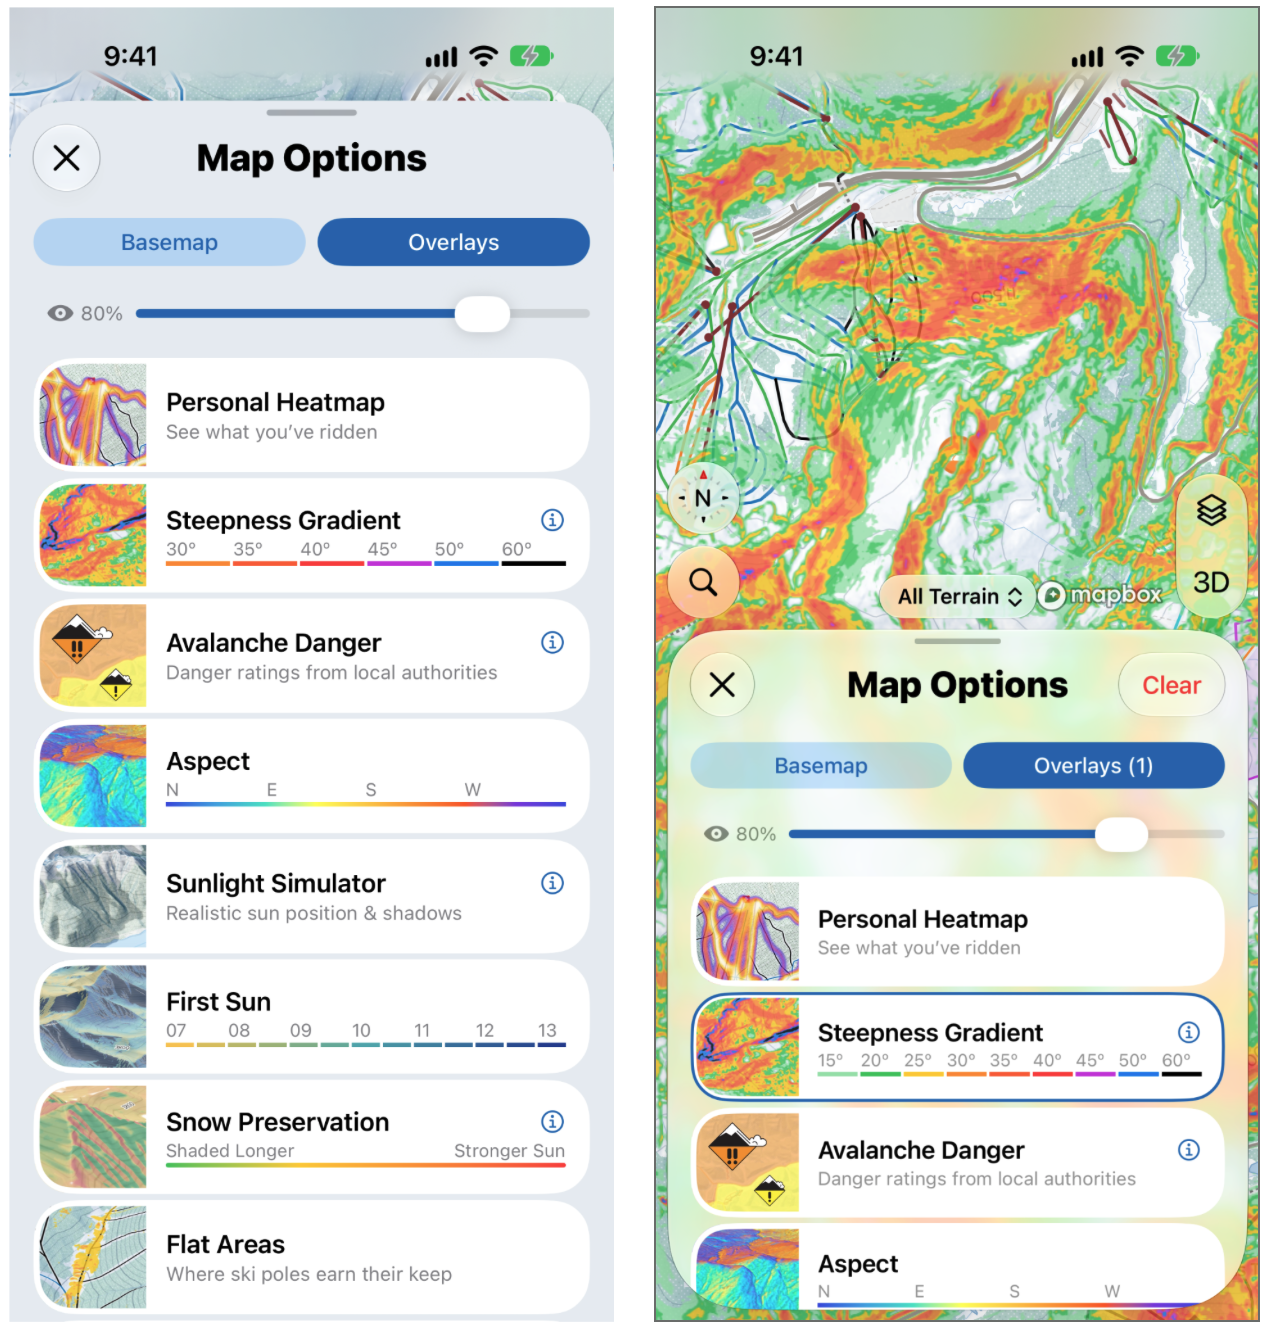
Each overlay colors the map to help answer a question you might ask before heading out. They work anywhere, both inside resorts and in the backcountry.
To turn one on, tap the layers button on the map, then tap Overlays. You can have more than one on at a time, and use the opacity slider at the top to make them more or less see-through. Some overlays have an ⓘ button. Tap it to read more about how that overlay works. To turn every overlay off at once, tap Clear at the top of Map Options.
⚠️ Overlays are calculated from elevation data. They're an interpretation of the terrain, not a measurement on the ground, and they don't tell you whether an area is safe.
Avalanche Danger (free)
What are the forecasters saying today? Shows danger ratings published by local avalanche forecast authorities.
Personal Heatmap
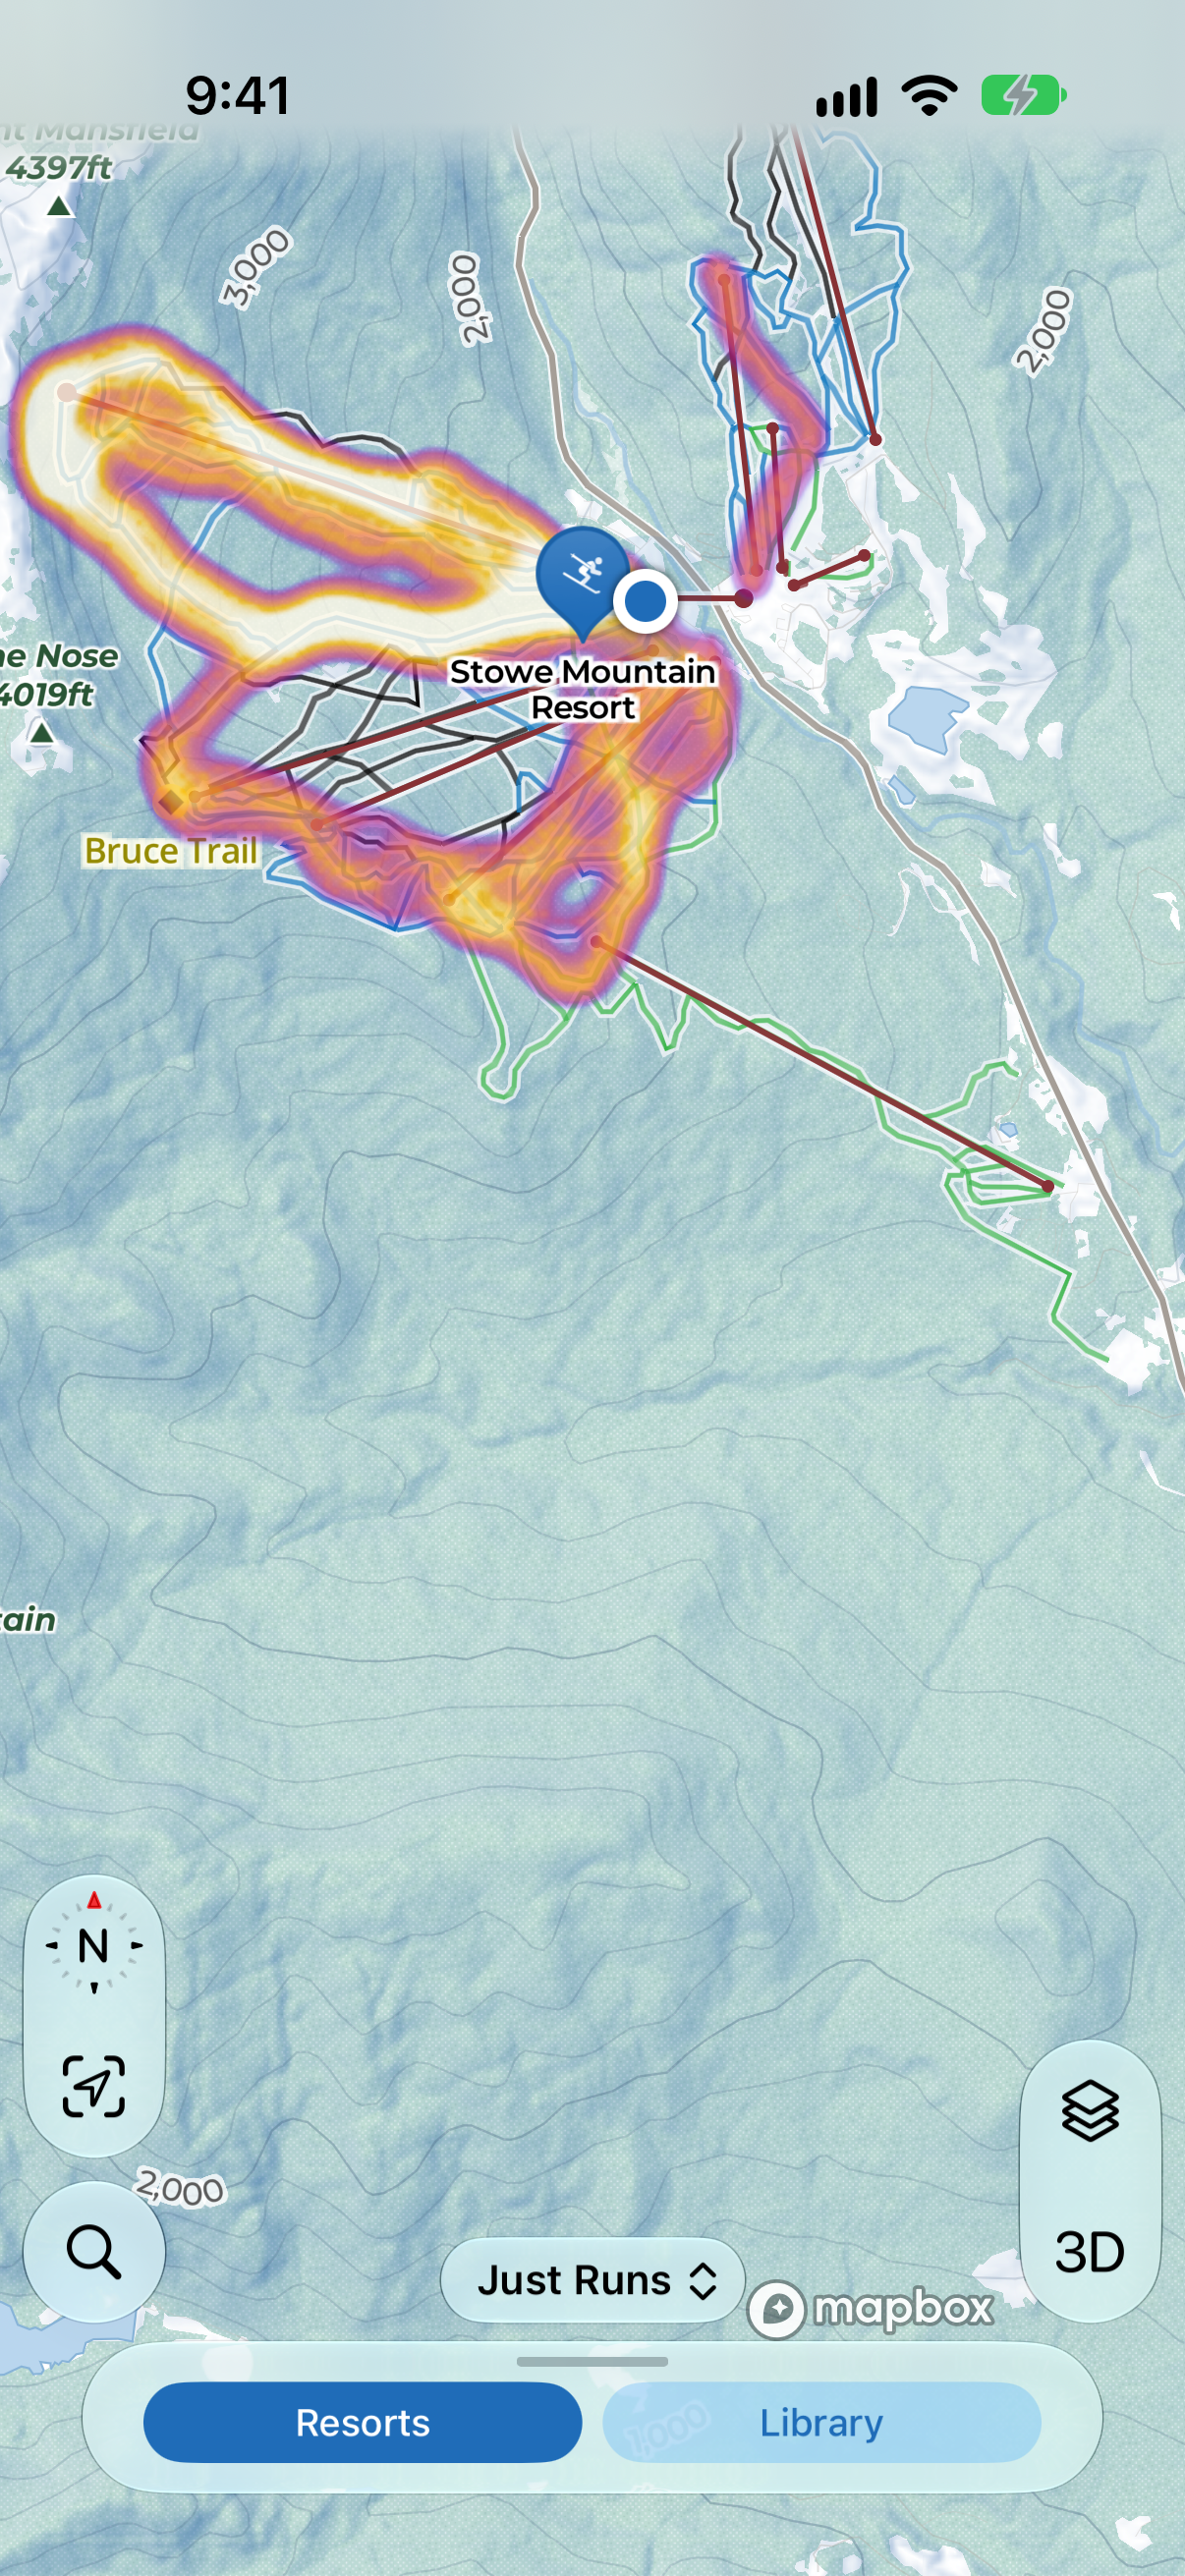
What have I already done here? Shows where you've ridden, brightest where you've been the most. Use the Runs + Lifts filter on the map to choose what it includes, for example to turn off lift rides.
Steepness Gradient
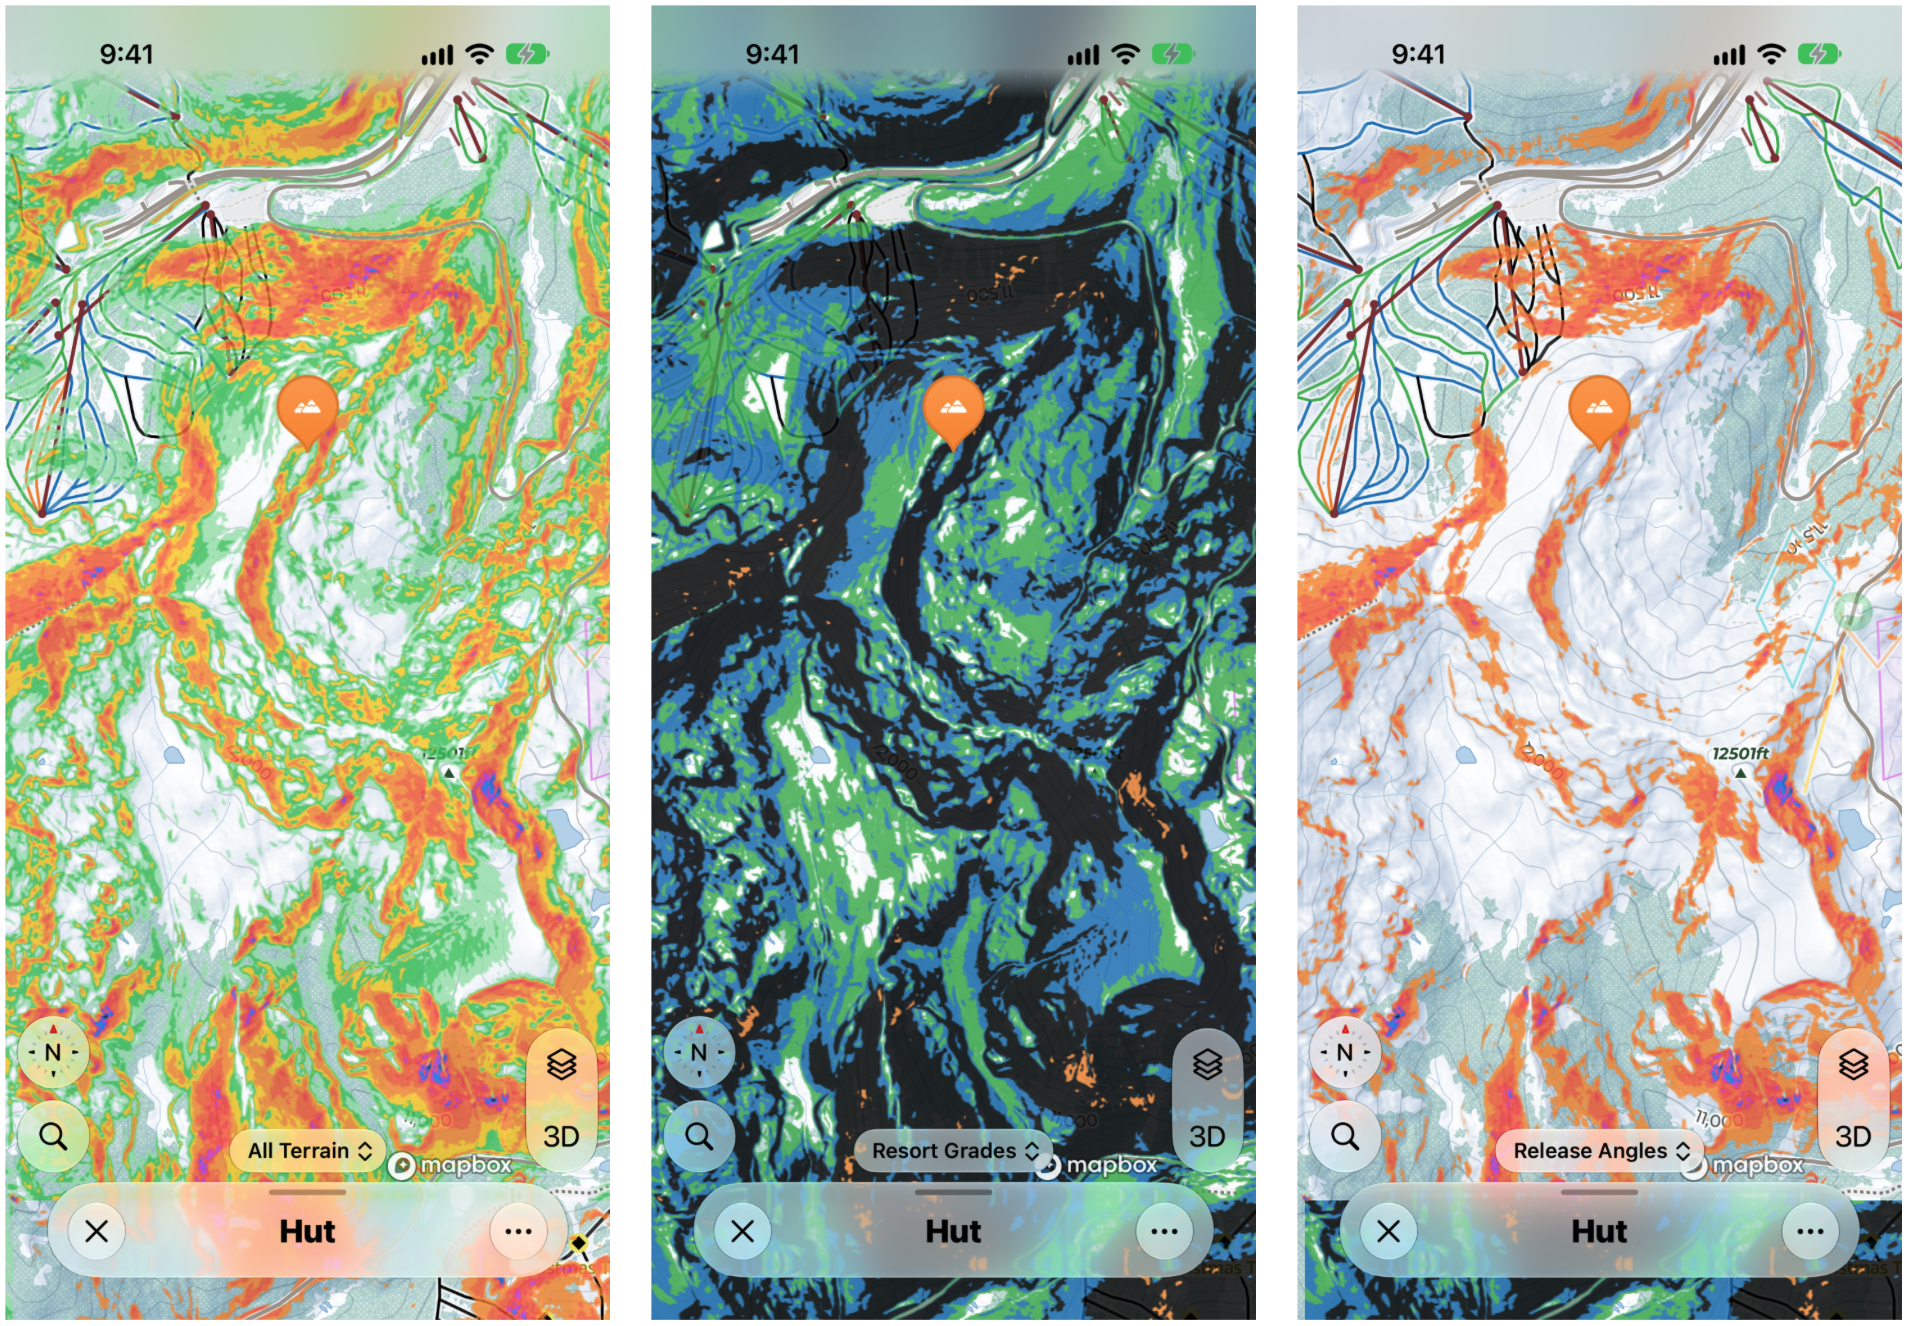
How steep is it? Bands the terrain by angle, from 15° to 60°+, going from green (gentler) through orange and red to black (very steep). Slopes between about 35° and 45° are generally considered the most prone to avalanches, and this makes them easy to spot.
With Steepness Gradient on, use the pill at the bottom of the map to switch between three views:
- All Terrain: the standard view, described above.
- Resort Grades: shades the terrain green, blue, black and double black, like the runs at a resort.
- Release Angles: only shades slopes steep enough for an avalanche to start. Avalanches can run a long way onto the flatter, unshaded ground below, so an unshaded area isn't necessarily safe.
Angles are estimated from elevation data, so they can miss small, steep features. Always check the slope in the field.
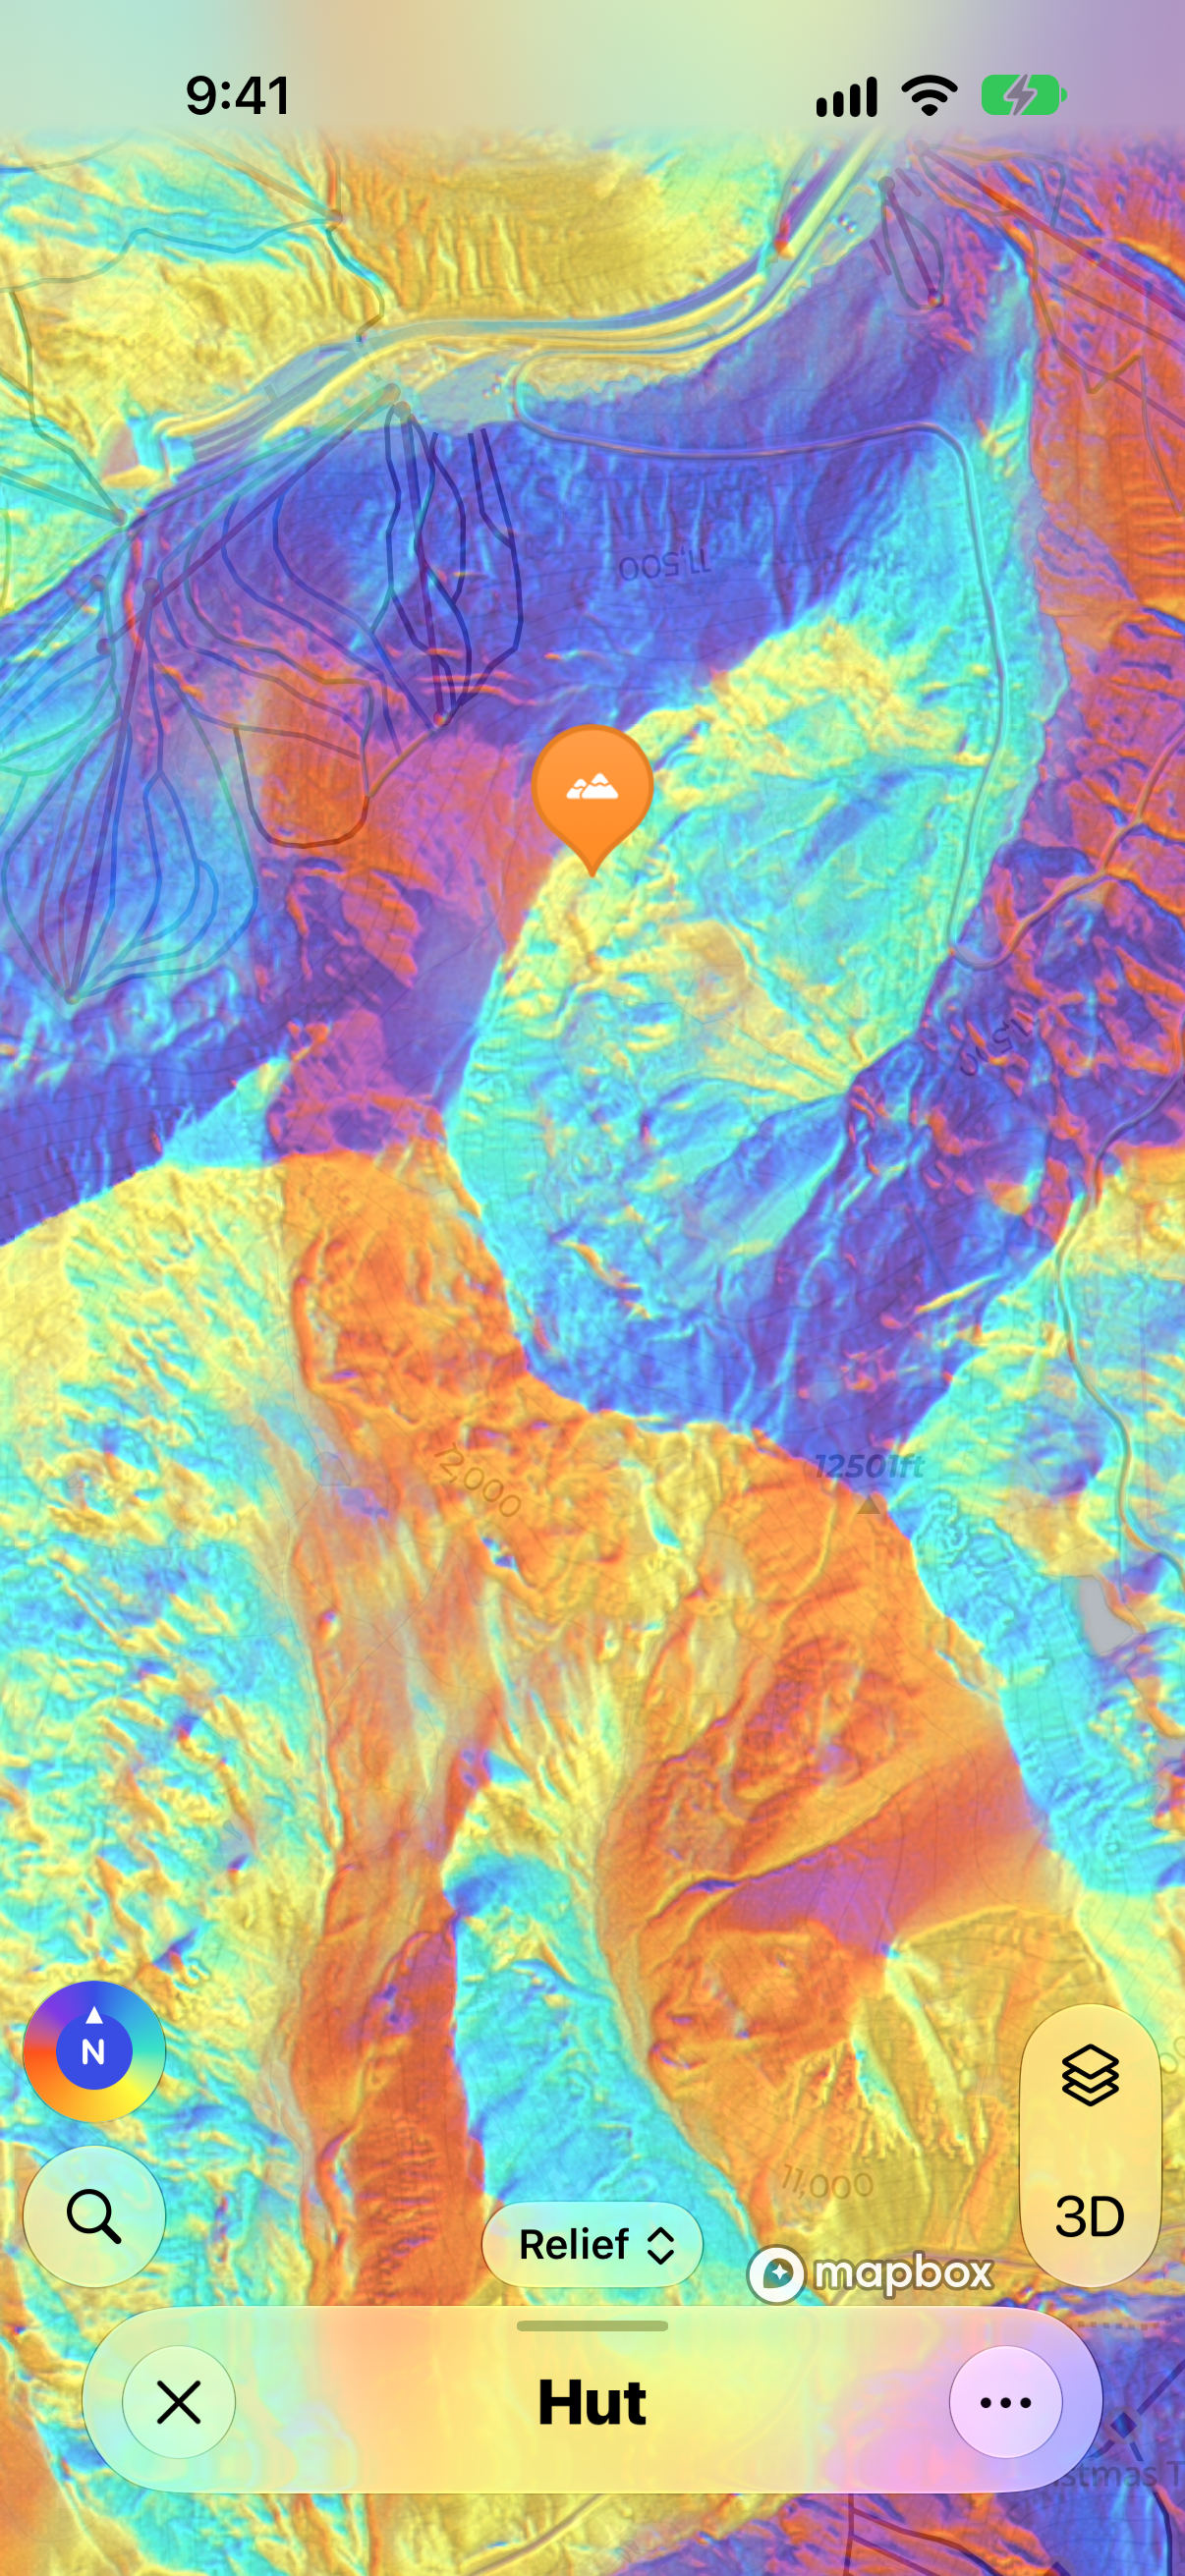
Aspect
Which way does this face? Colors the terrain by direction: north, east, south and west. Useful for working out where the best snow might be, or which slopes will have had the most sun. To change how it's shown, use the pill at the bottom of the map, which says Relief to start with.
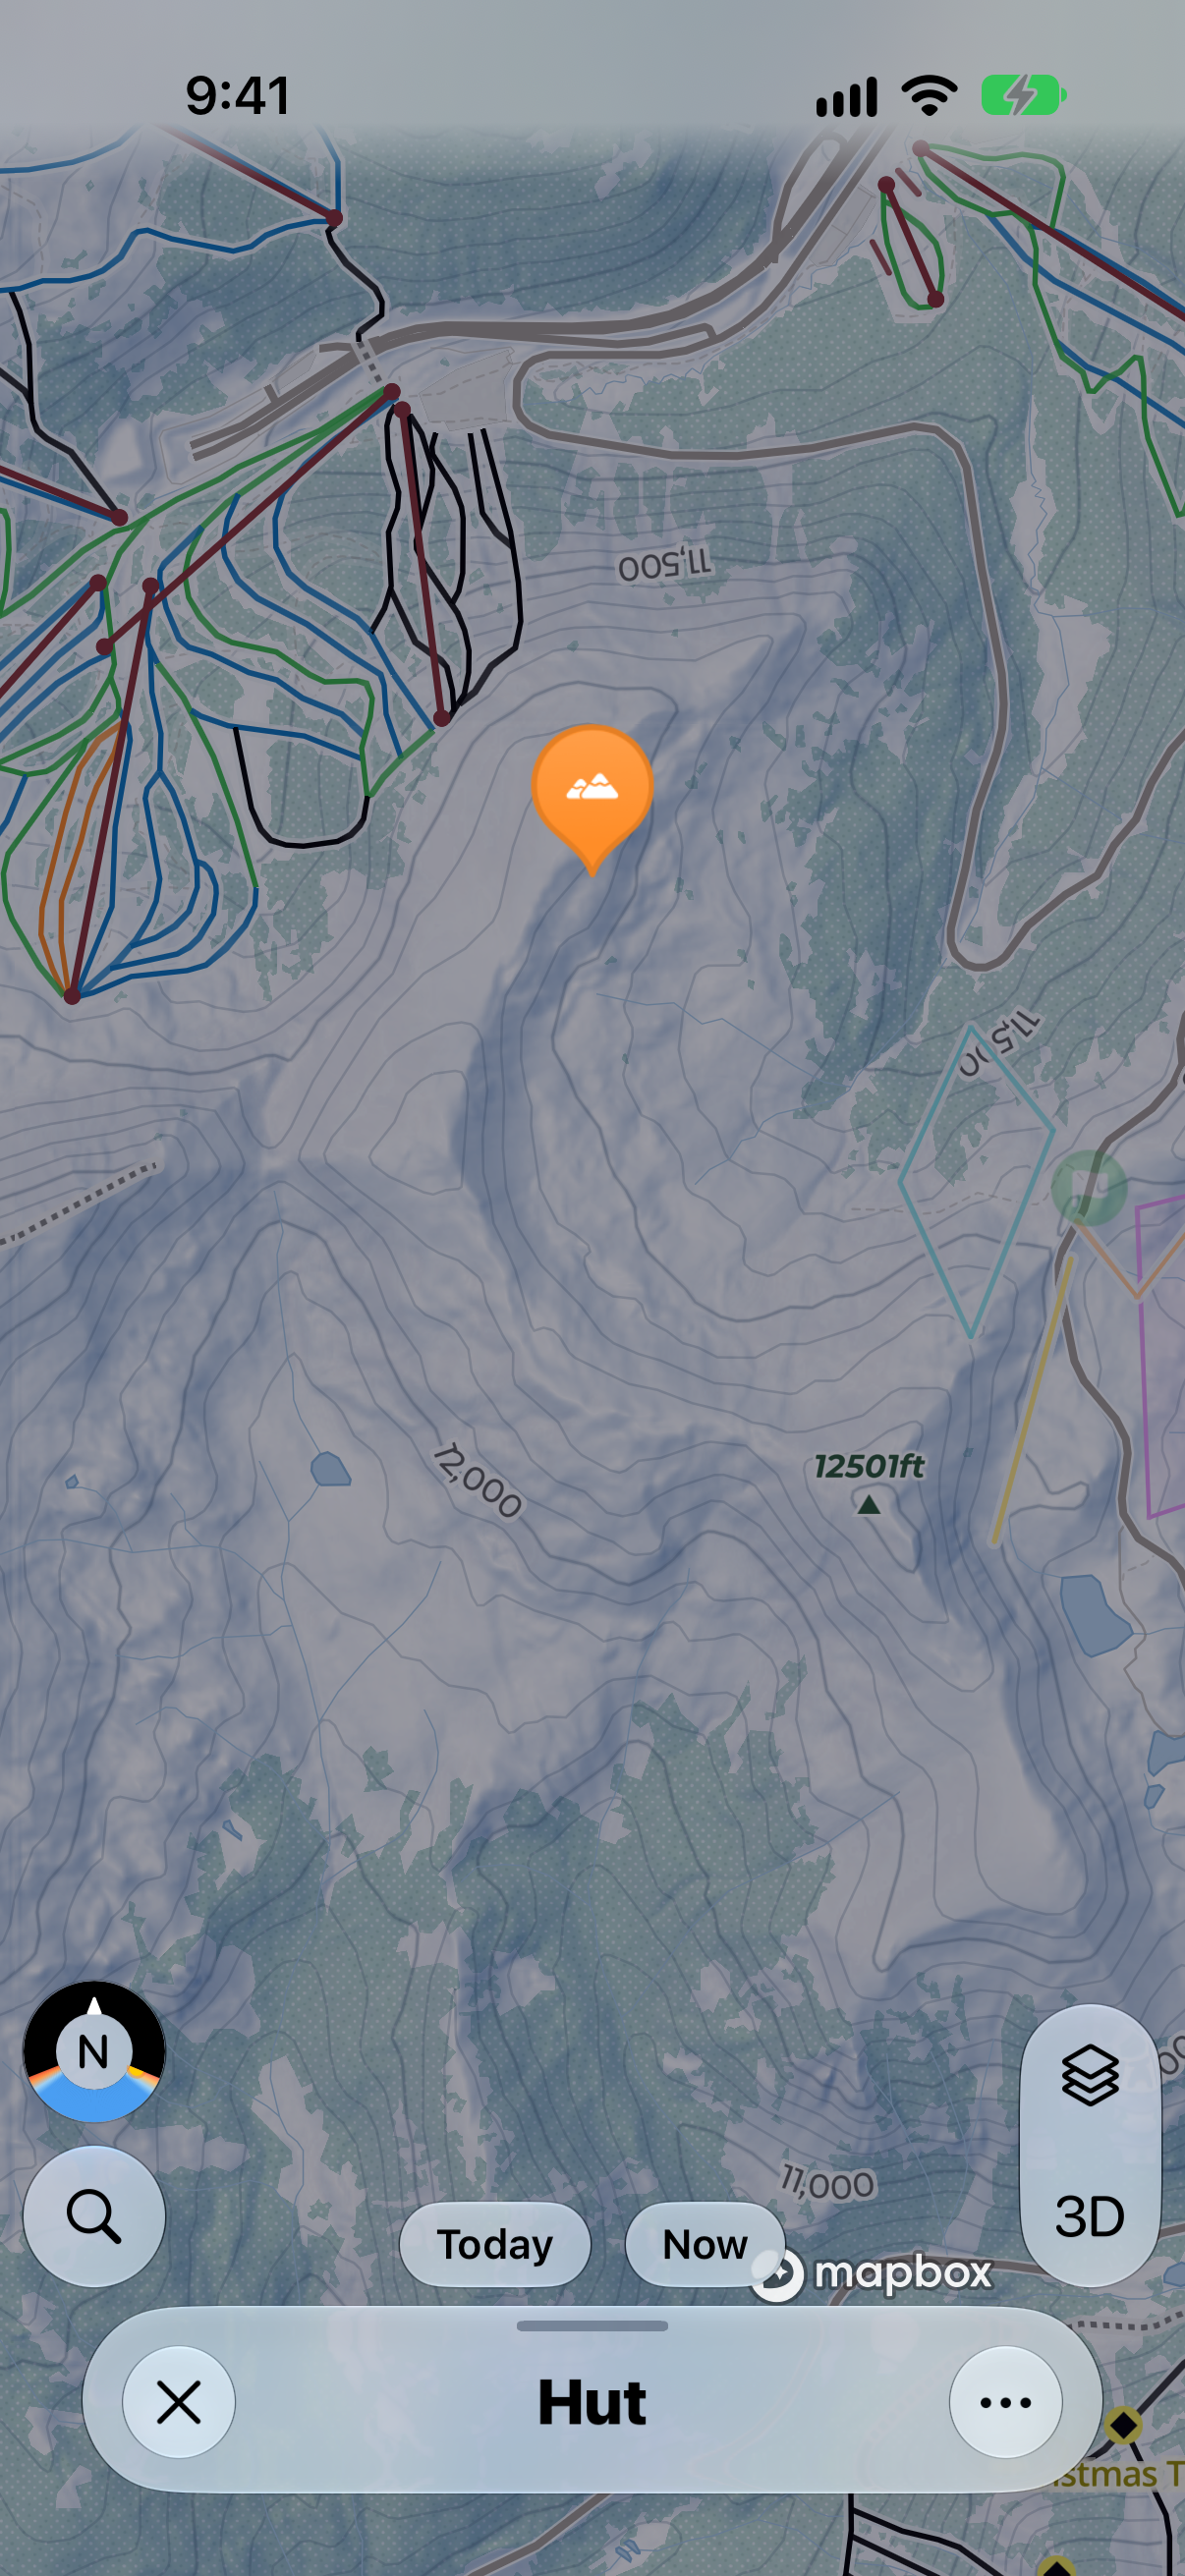
Sunlight Simulator
What will the light be doing? Shows the sun and shadows for a date and time you choose, based on the shape of the terrain.
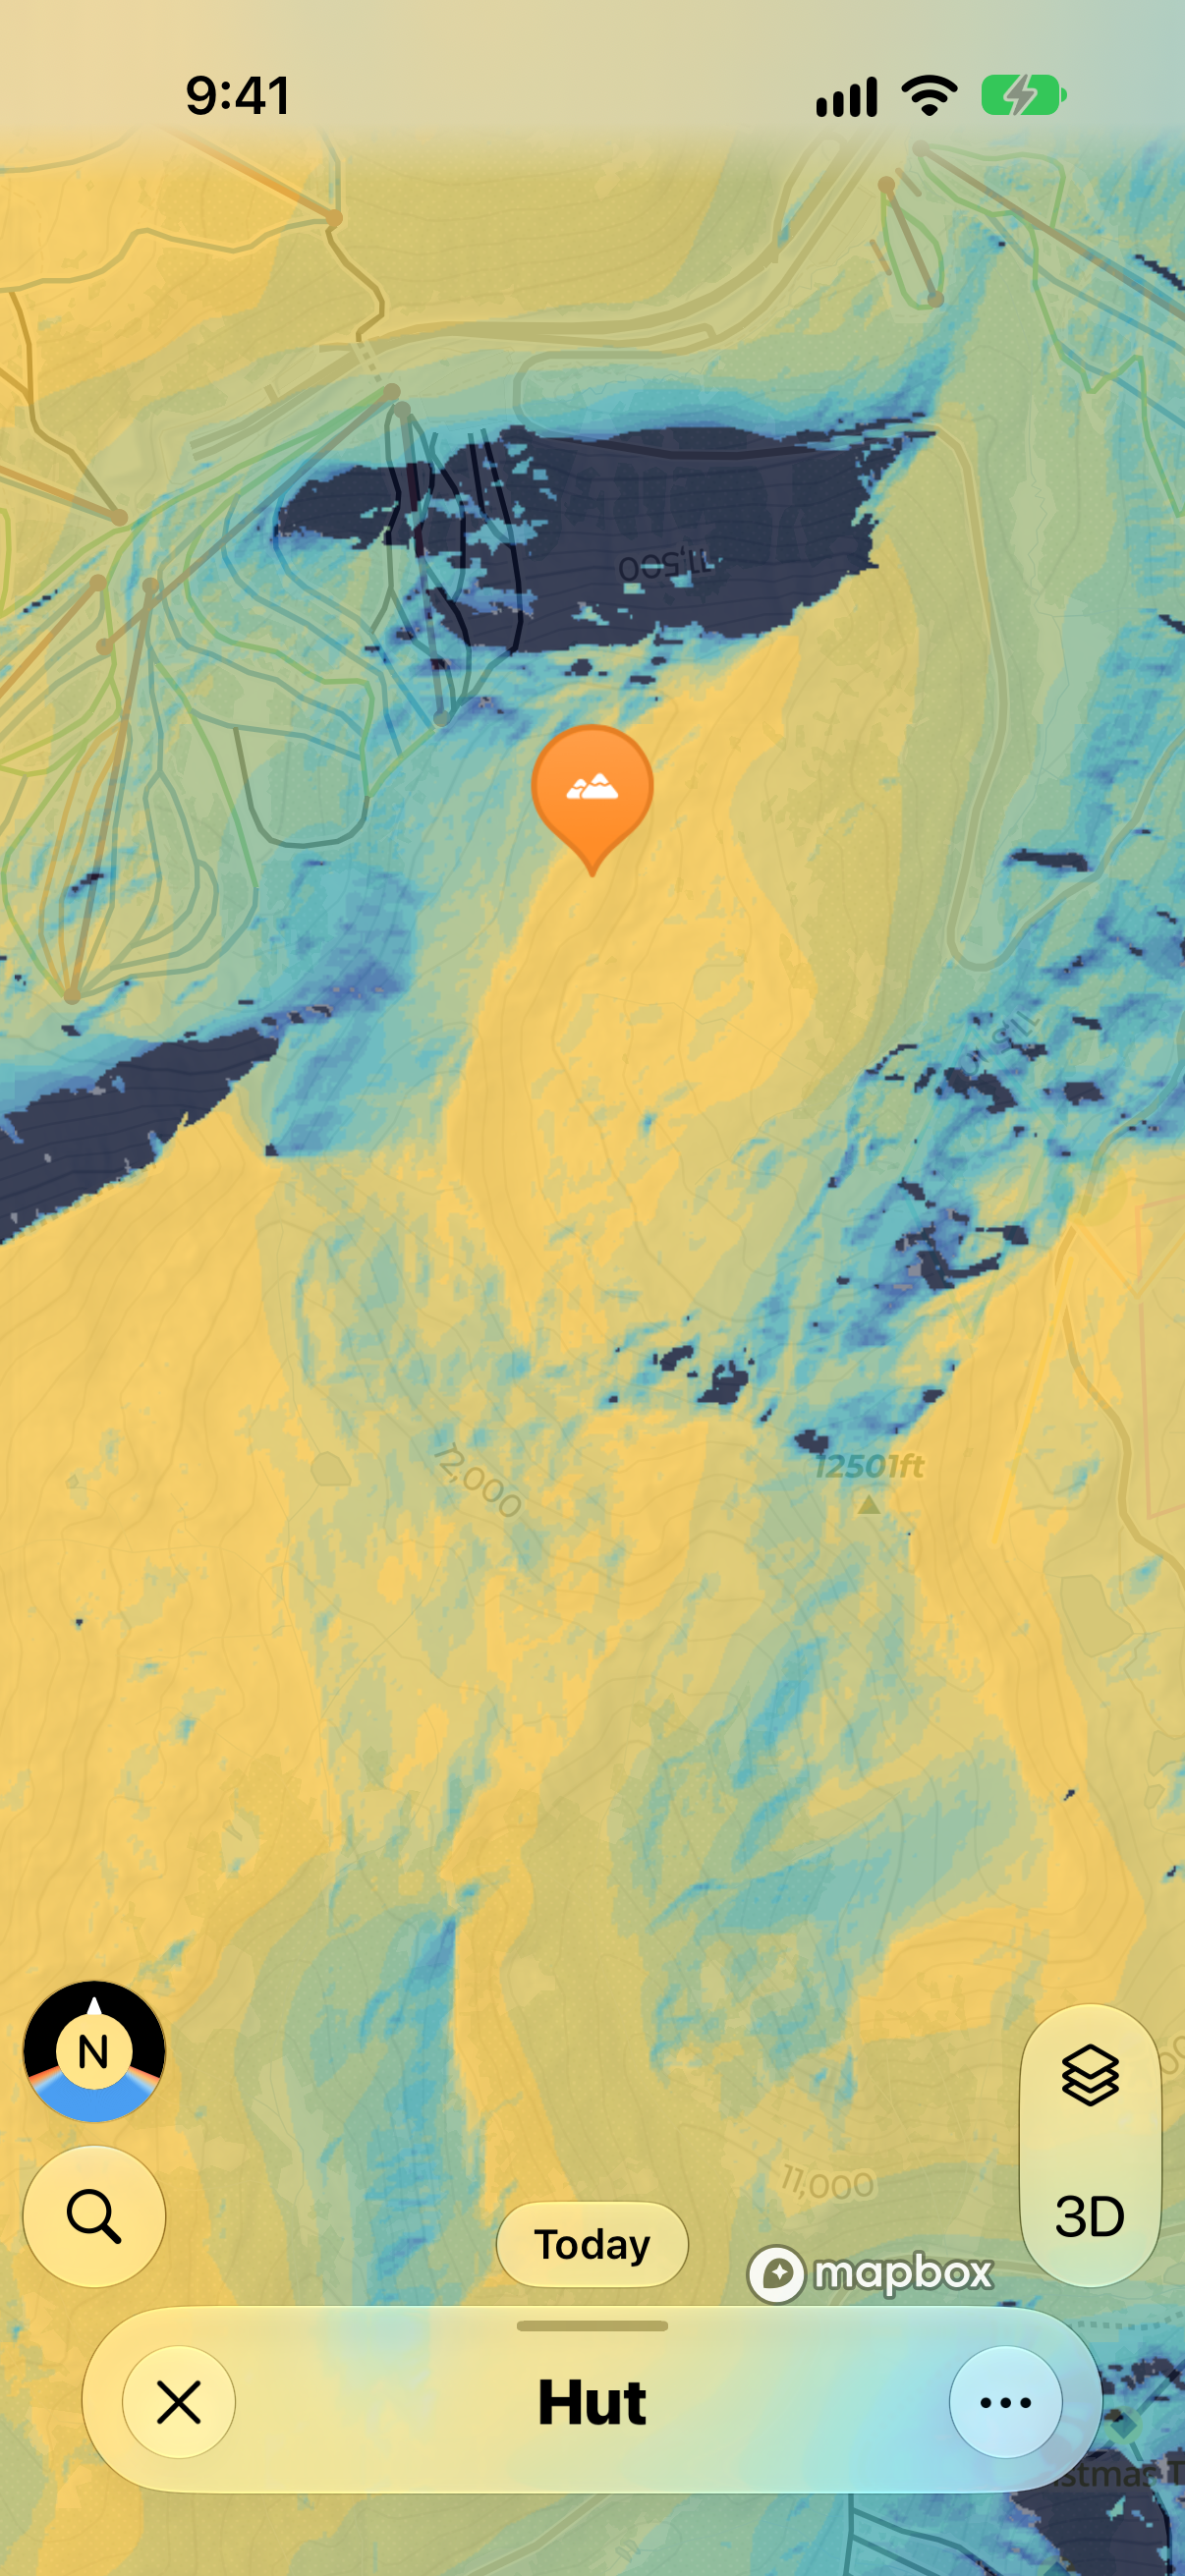
First Sun
When does the sun hit? Shows, hour by hour from 07:00 to 13:00, when direct sunlight first reaches each slope. Great if you want to stay in the shade as long as possible for the best snow.
Snow Preservation
Where is the snow most protected? Shows how much sun each area gets through the day, from green (Shaded Longer, so the snow holds up) to red (Stronger Sun, so it softens faster).
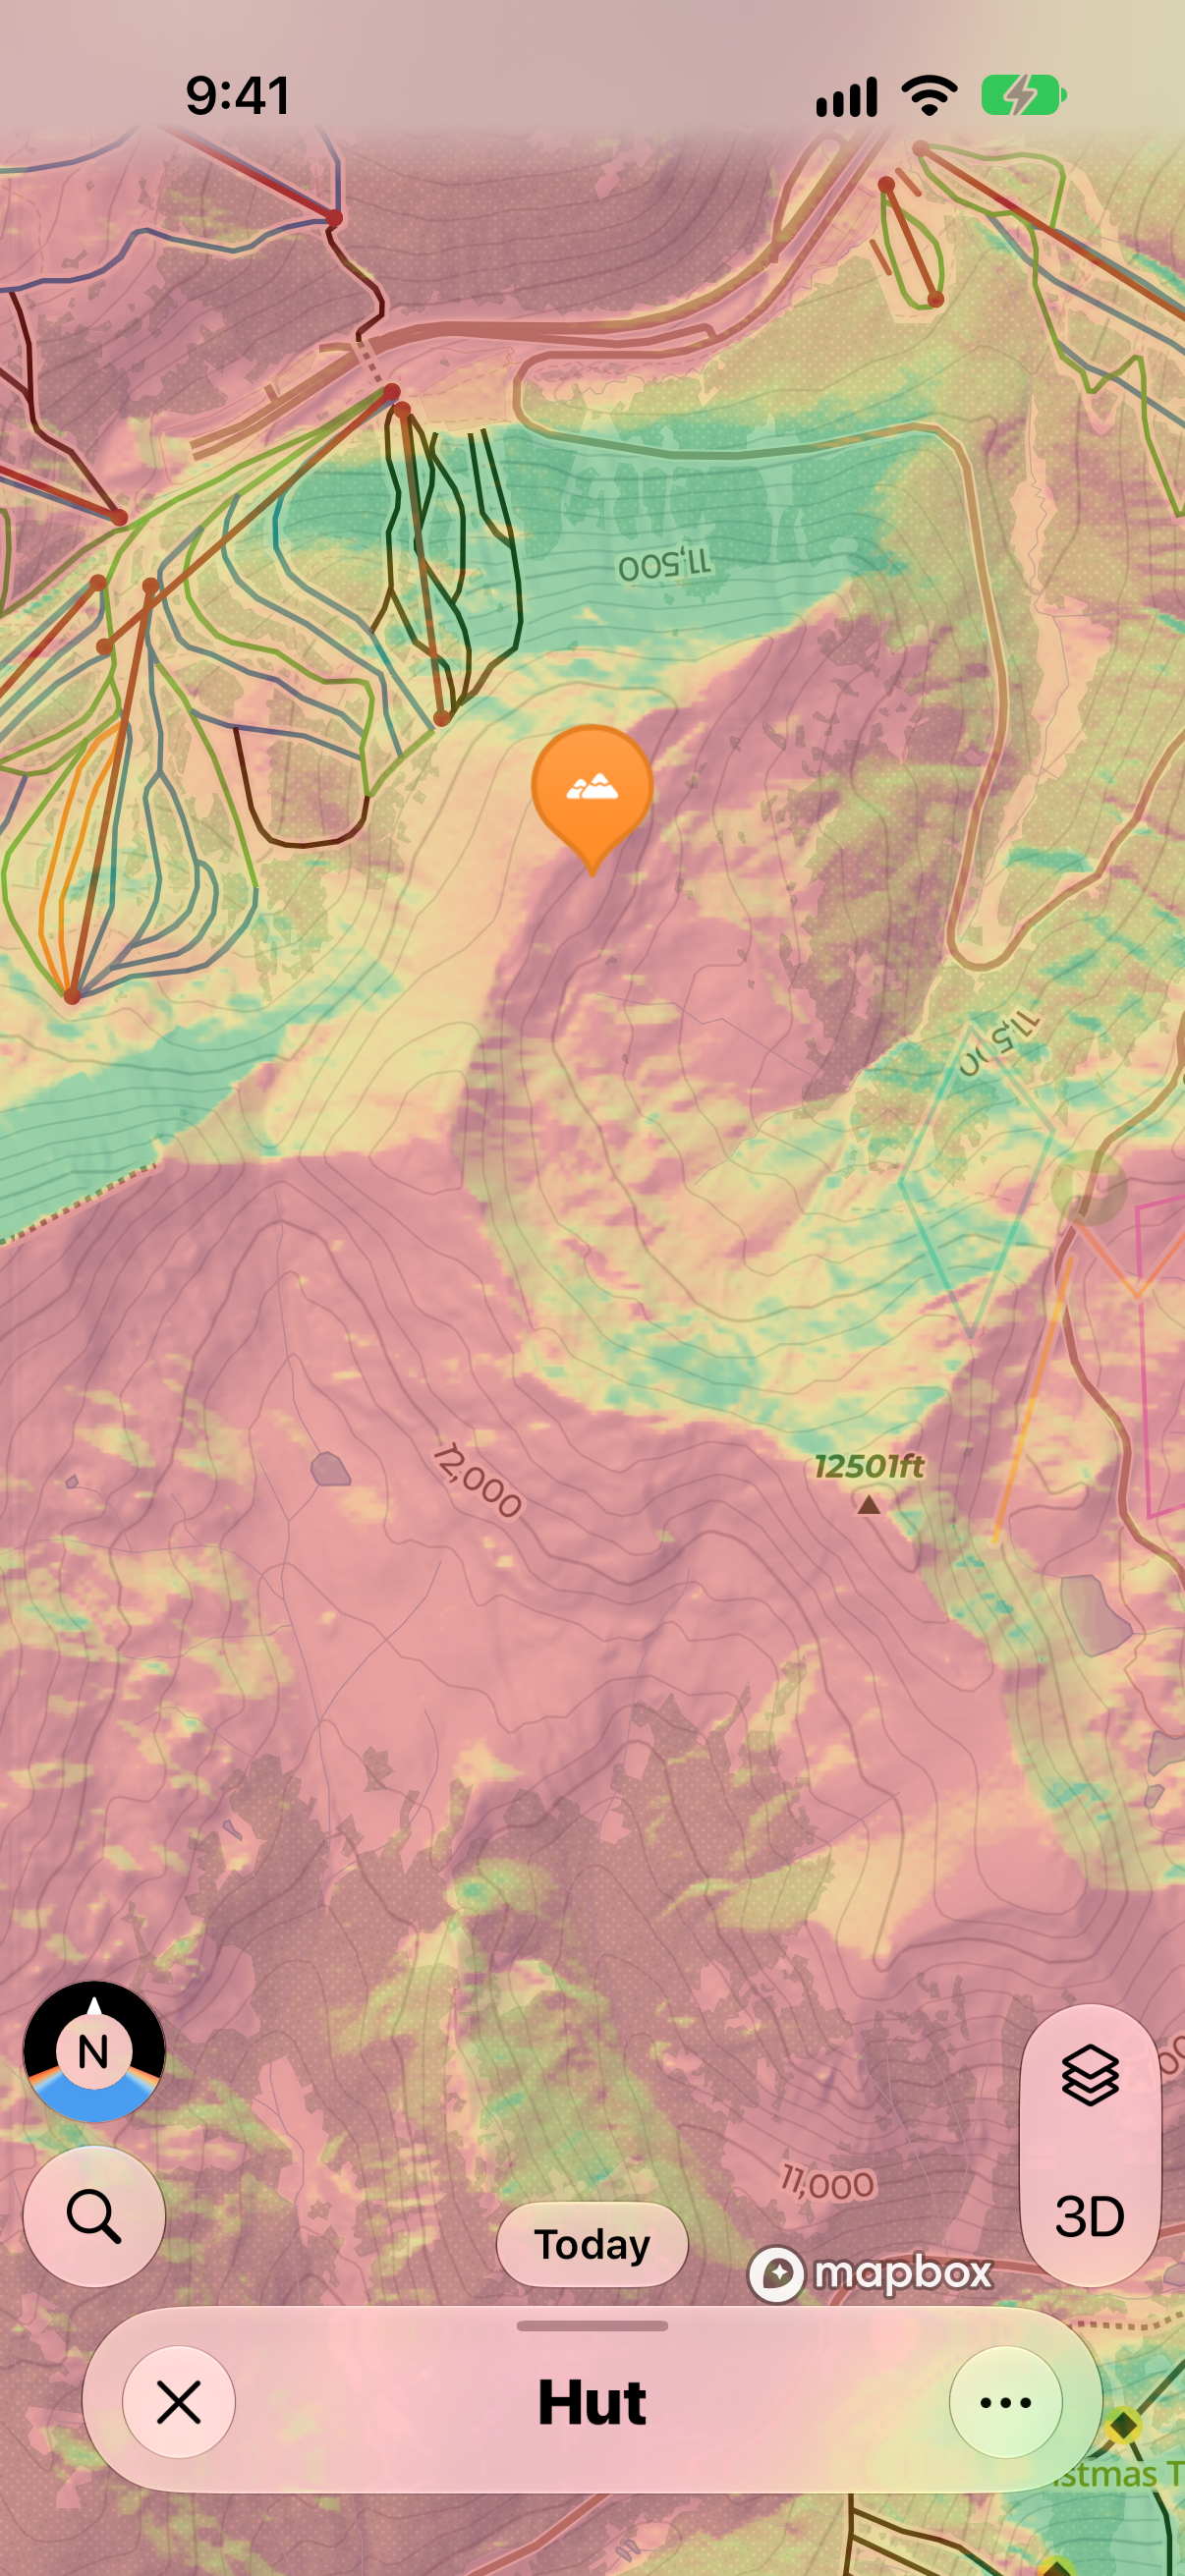
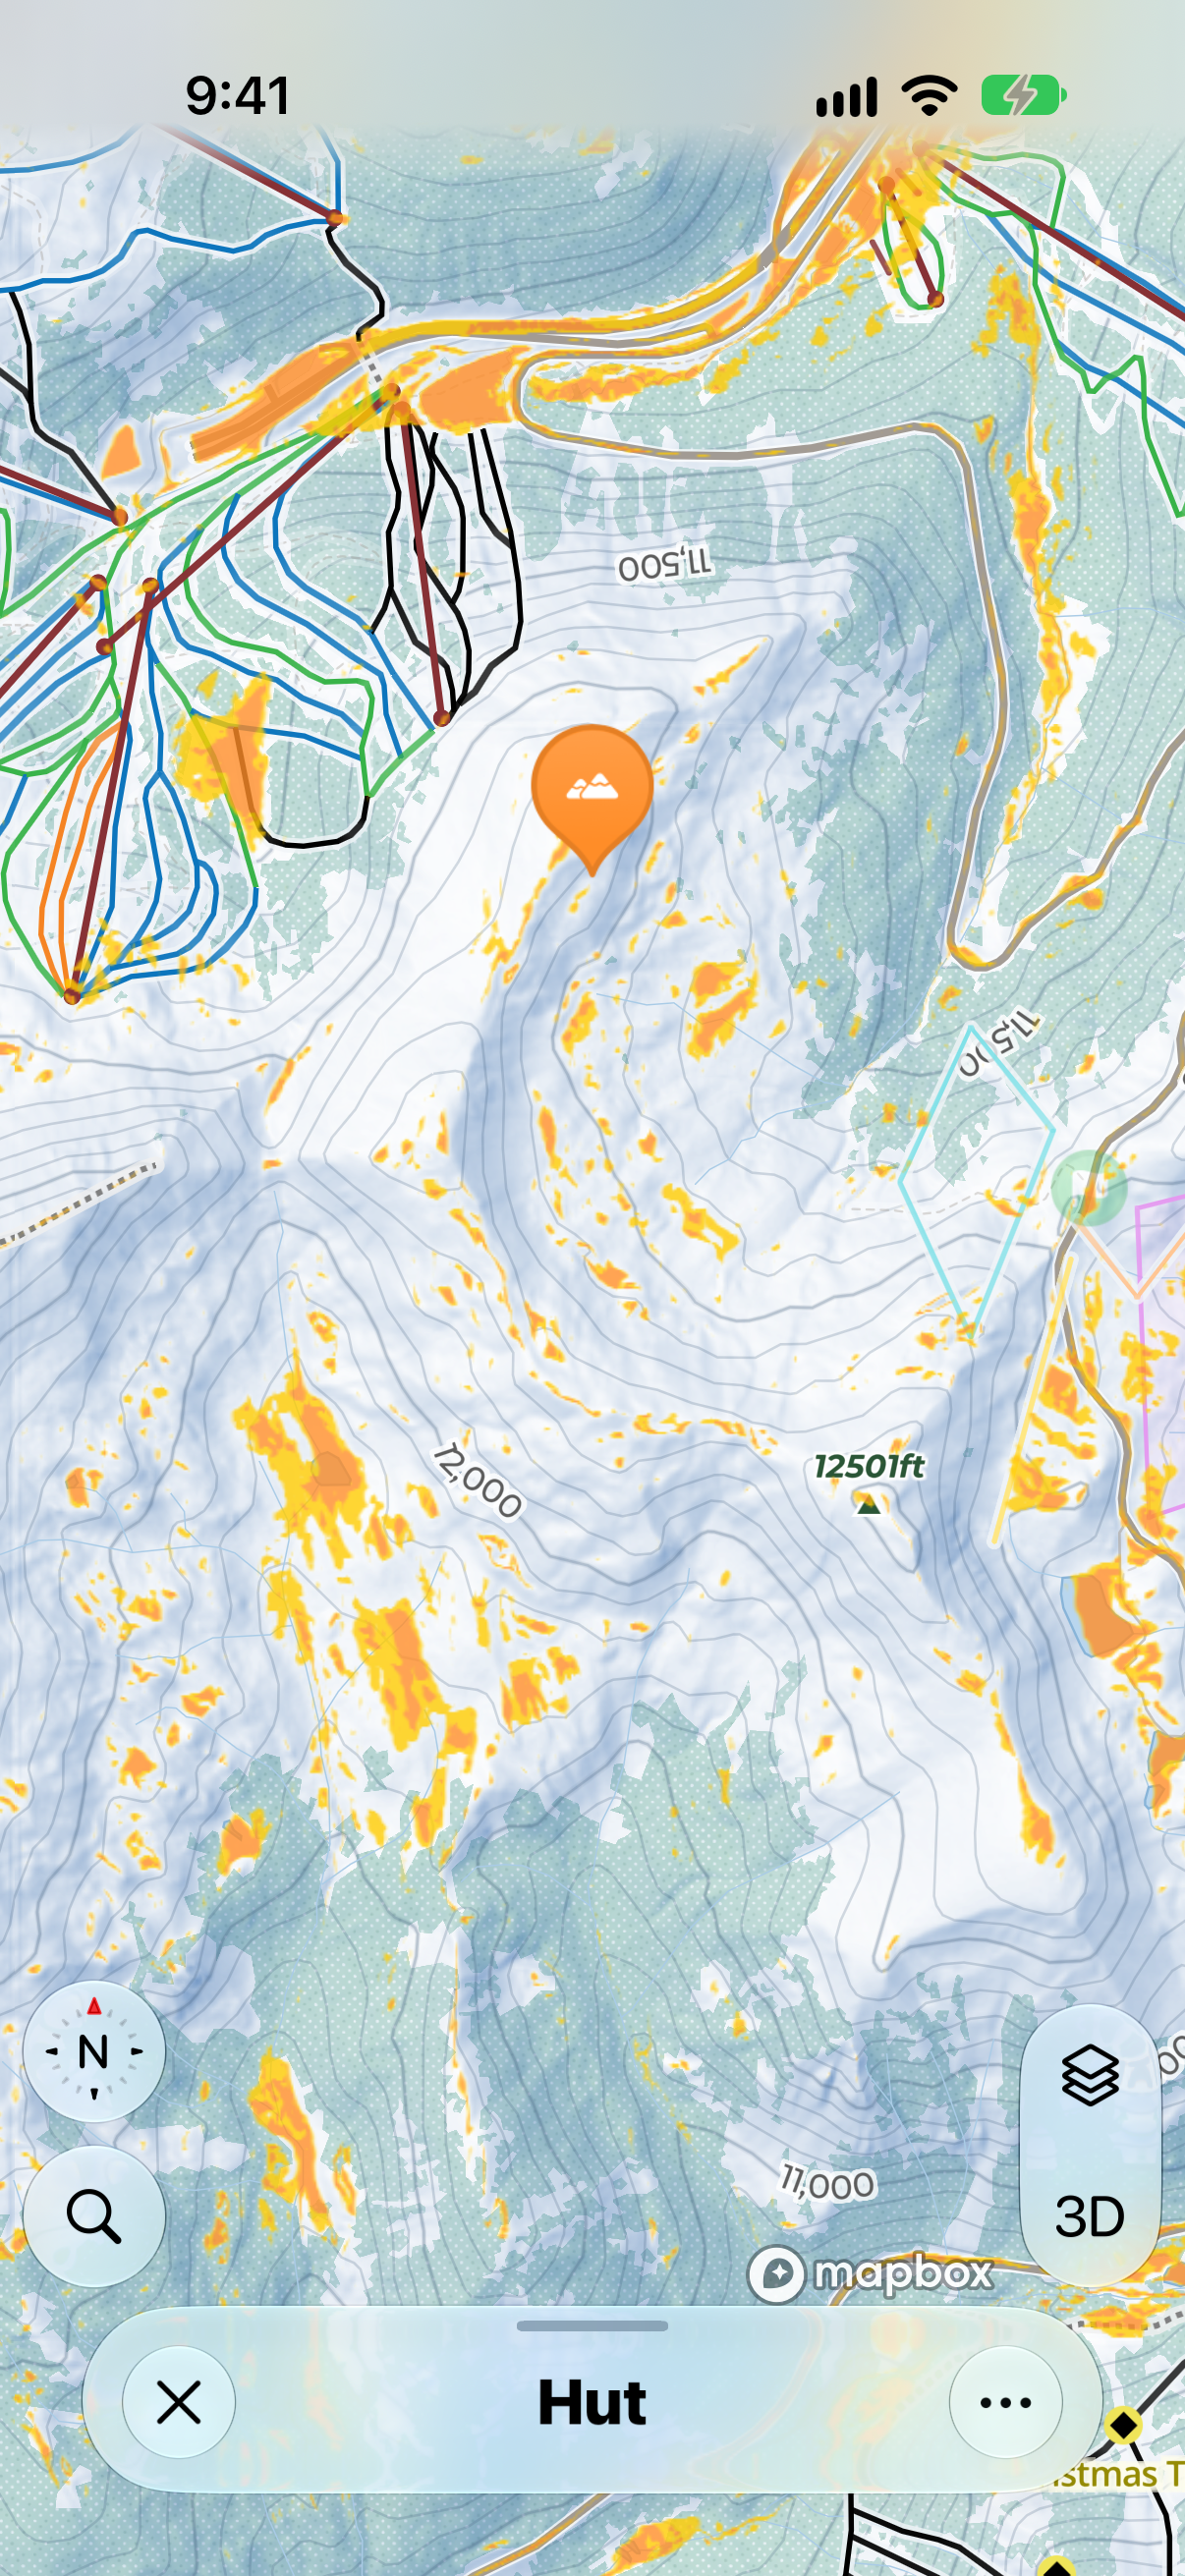
Flat Areas
Where will I lose momentum? Highlights flat terrain where skiers might need to pole and snowboarders might need to unstrap. It doesn't know which way you're coming from or how fast you'll be going, so use it as a guide.
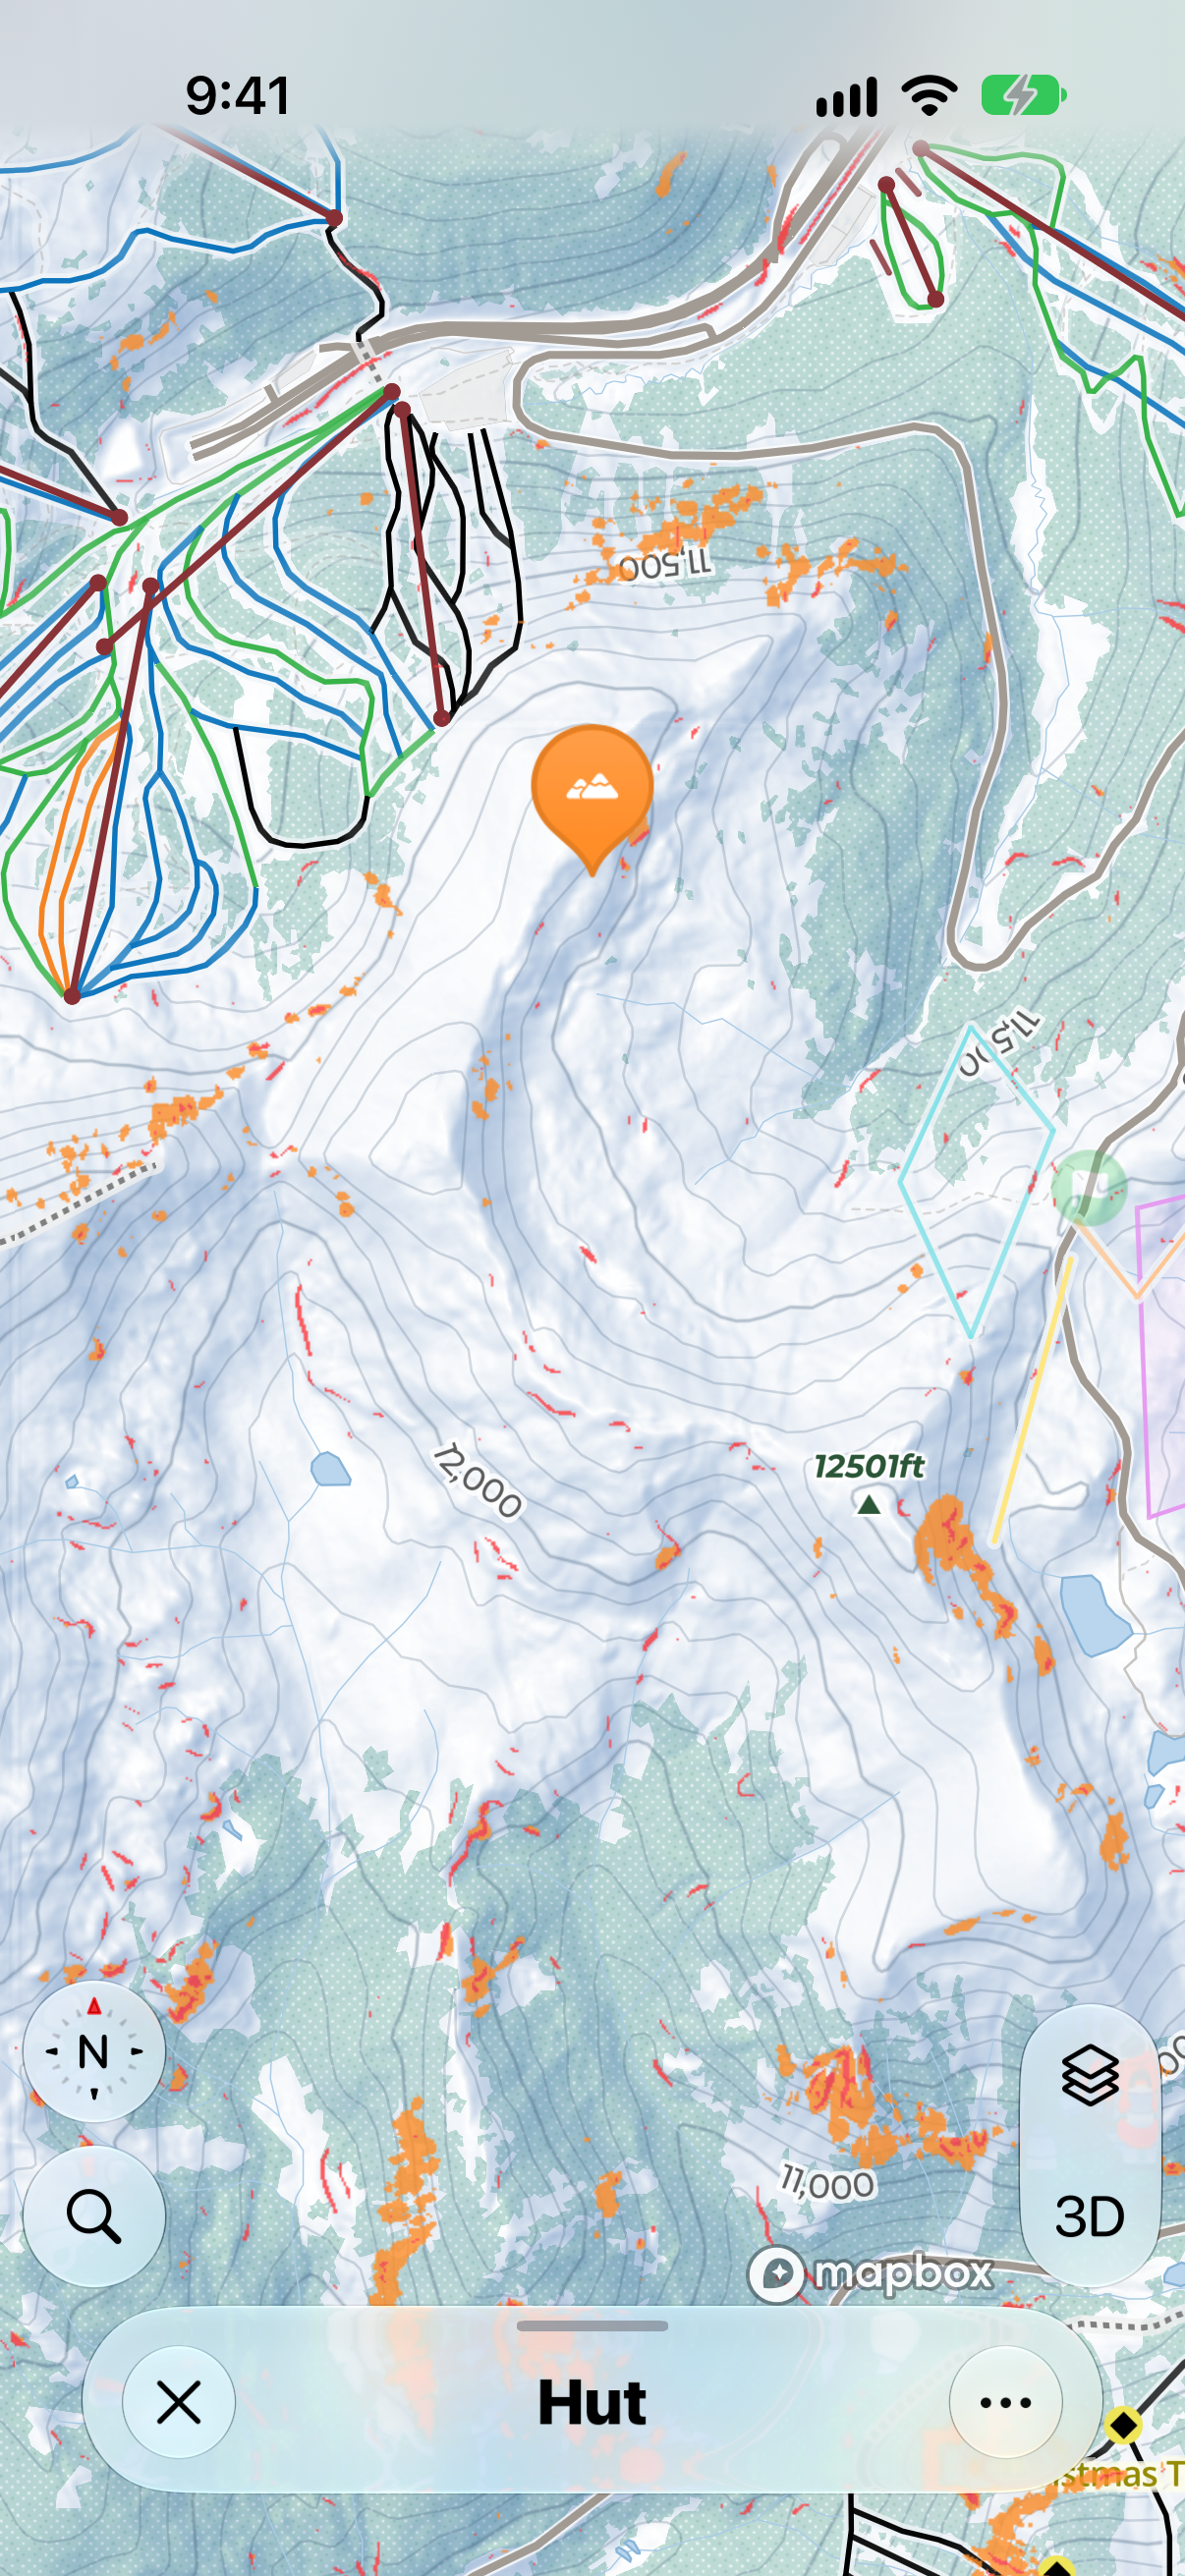
Extreme Terrain
Where does it get serious? Highlights sustained steeps and sudden drops, like cliff bands, rather than just steep slopes.
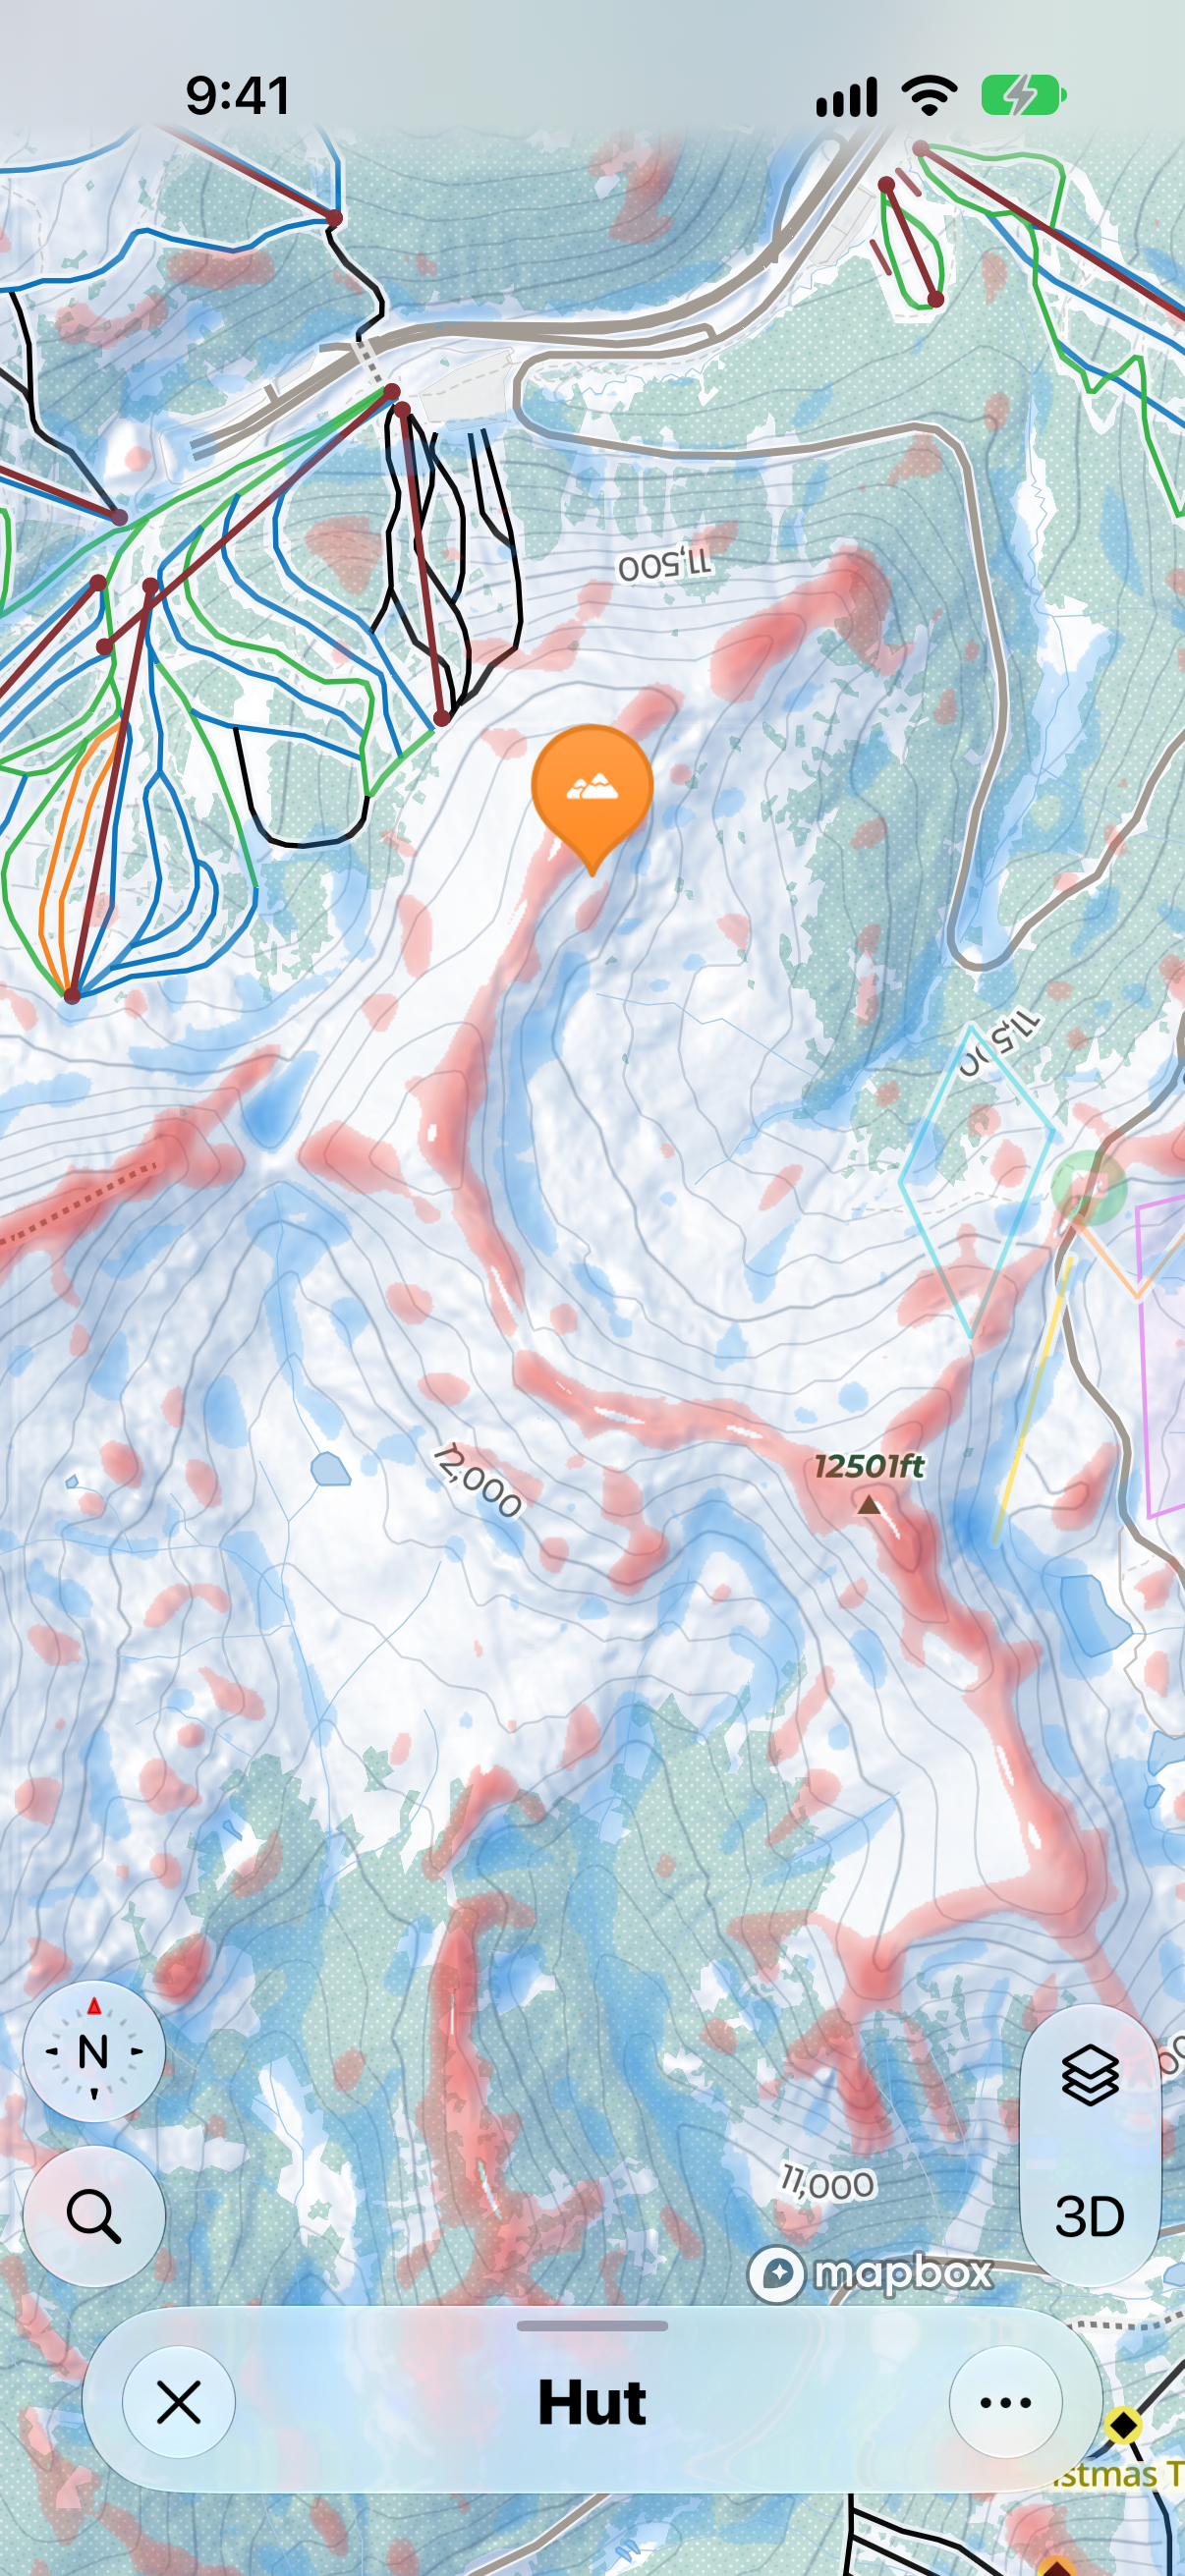
Terrain Curvature
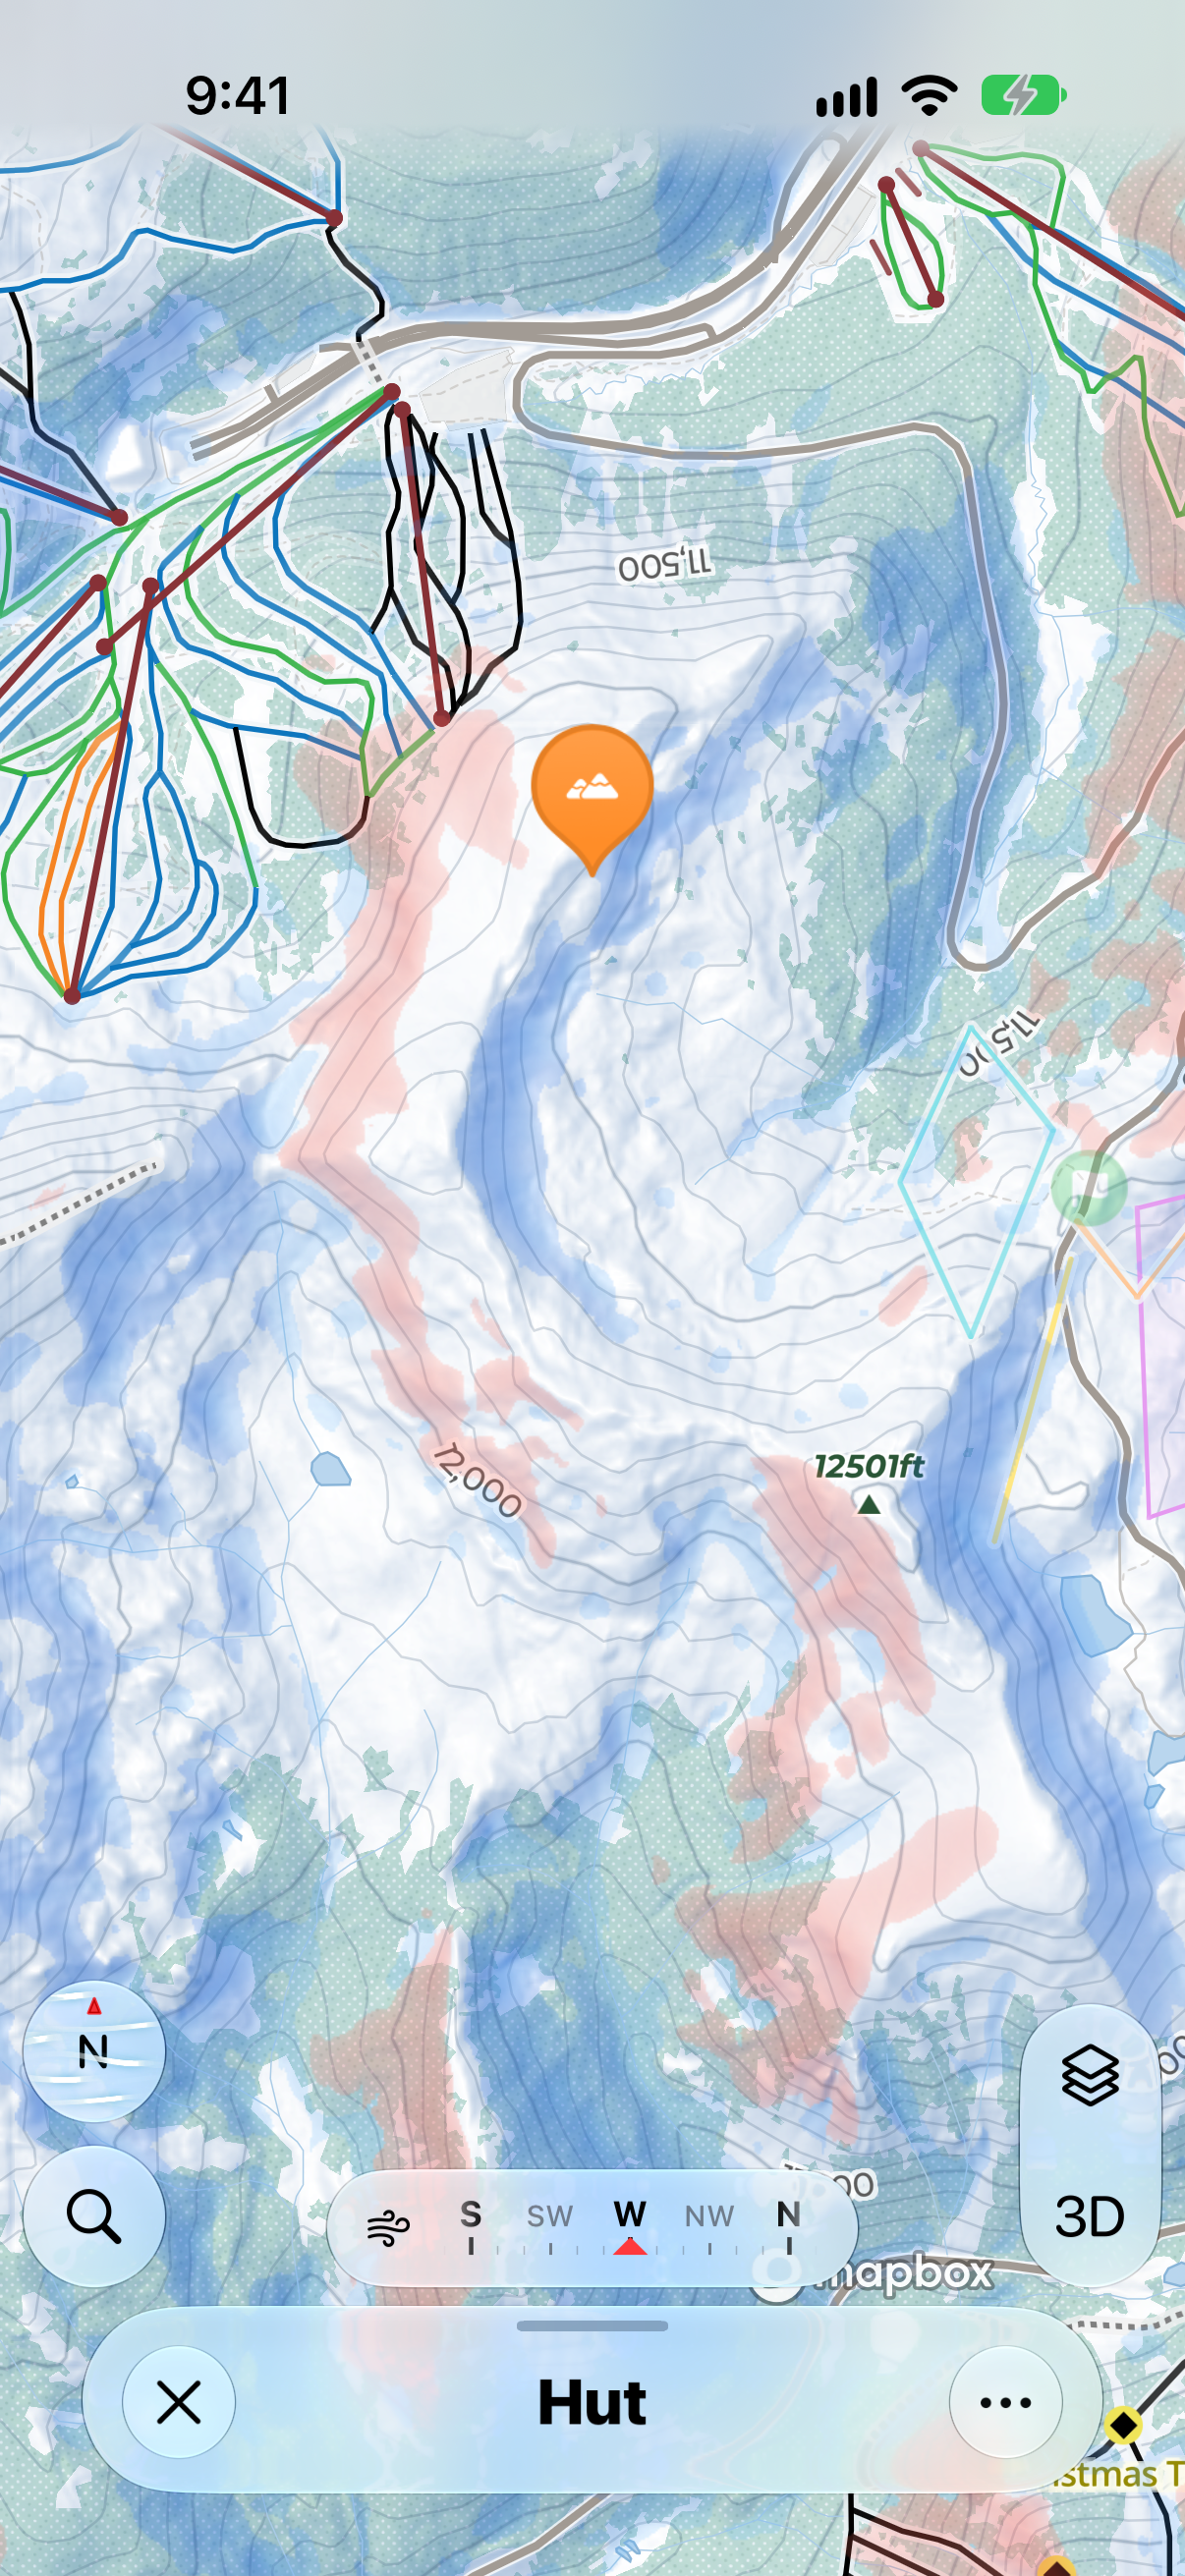
Am I in a gully or on a spine? Shows troughs in blue (terrain that funnels, like a gully) through to ridges in red (terrain that sheds, like a spine).
Wind Loading Simulator
Where are the pockets of deep snow? Shows where snow is likely to pile up (Accumulation, blue) and where it's likely to be blown away (Scouring, red). Set the wind direction with the on-screen compass and choose a wind speed, and the map updates to match. It assumes the wind and snowfall stay constant, so use it as a guide rather than an exact picture.